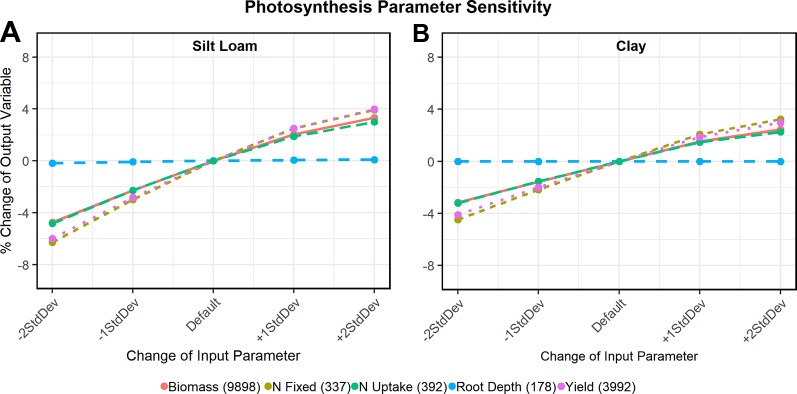
Figure 6.
Sensitivity analysis of oxdef_photo parameters on a silt loam soil (A) and clay soil (B). The output variables (y-axis) shown in each graph are biomass (kg ha-1), N uptake (kg ha-1), N fixation (kg ha-1), maximum root depth (cm), and end of season grain yield (kg ha-1). In the legends, the numbers in parentheses in the output variables refer to the default values.

