Figure 2.

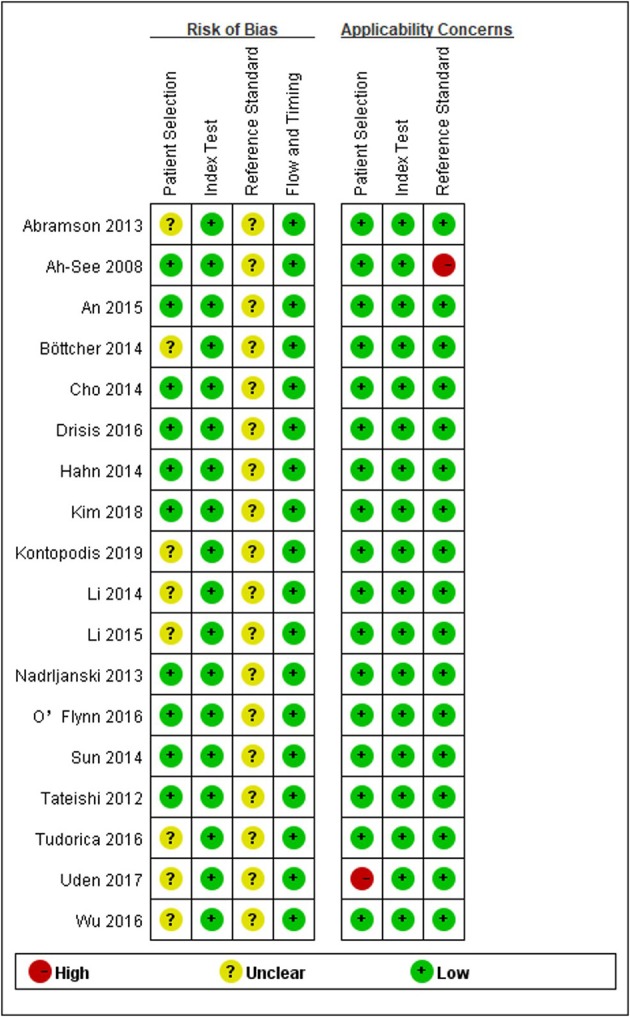
Grouped bar charts showing risk of bias (Left) and concerns for applicability (Right) for each included study using QUADAS-2.

Grouped bar charts showing risk of bias (Left) and concerns for applicability (Right) for each included study using QUADAS-2.