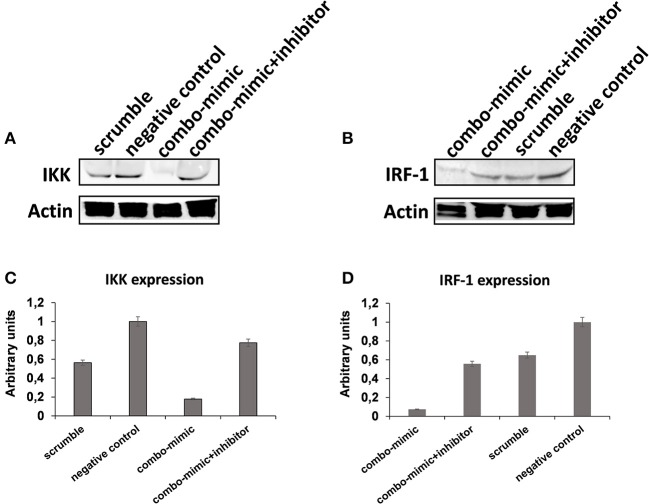
Figure 10.
Western blot analysis of IKK, IRF-1, and Actin protein in whole lysates of purified monocytes. (A) Western blot image of IKK and Actin protein. (B) Western blot image of IRF-1 and Actin protein. (C) IKK Western blot results quantified by ImageJ software. (D) IRF-1 Western blot results quantified by ImageJ software. Protein expression was normalized to β-Actin, and the ratio to relevant control was presented as fold changes (C,D). In the combo-mimic treatment for IKK, the cells were transfected with miR-223-3p and miR-23a-3p. In the combo-mimic treatment for IRF-1, the cells were transfected with miR-23a-3p, miR-130b-3p, and miR-125b-5p.

