Figure 2.
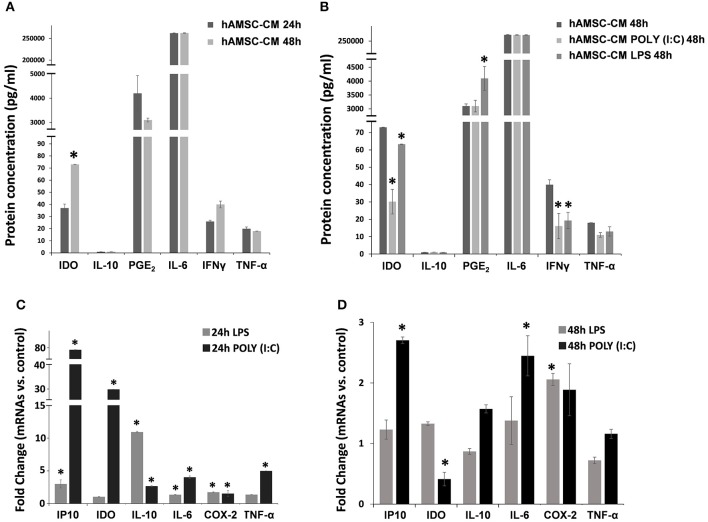
Expression analysis of immunomodulatory factors. Both protein (A,B) and gene (C,D) expression were assayed after 24 or 48 h of cultures in CM and cells, respectively. (A) Protein expression of immunomodulator factor in hAMSCs cultured for both 24 and 48 h. (B) Protein expression of immunomodulator factor in hAMSCs cultured for 48 h and treated with poly (I:C) or LPS. (C) Gene expression of immunomodulator factor in hAMSCs cultured for 24 h and treated with poly (I:C) or LPS. (D) Gene expression of immunomodulator factor in hAMSCs cultured for 48 h and treated with poly (I:C) or LPS. Transcript levels were normalized to those of GAPDH, and expressed as fold change vs. untreated cells (control). Data are means ± SD. *p < 0.05 vs. control.

