Figure 4.
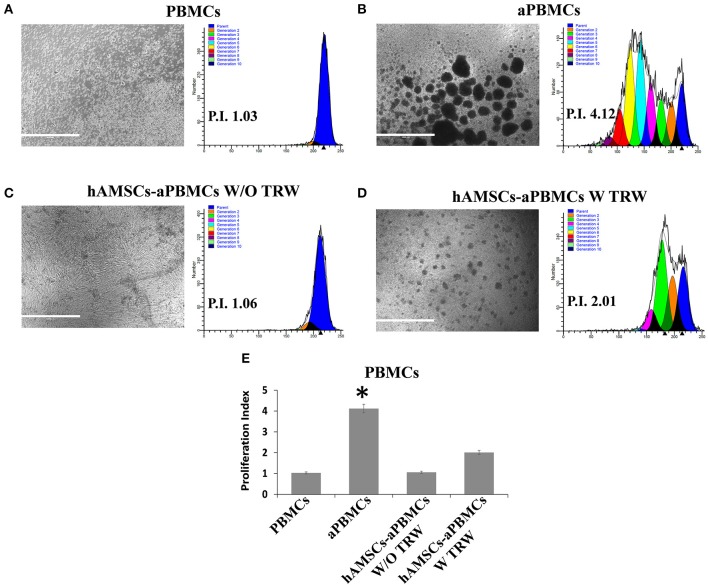
FACS analysis of PBMC proliferation co-cultured with hAMSCs. (A) Representative images and respective FACS graphic of unstimulated PBMCs grown alone (PBMCs). (B) Representative images and respective FACS graphic of PBMCs grown alone and activated with anti-CD3, anti-CD28, anti-CD40, and anti-BCR (aPBMCs). (C) Representative images and respective FACS graphic of hAMSCs co-cultured with PBMCs activated with anti-CD3, anti-CD28, anti-CD40, and anti-BCR, without Transwell (hAMSCs-aPBMCs W/O TRW). (D) Representative images and respective FACS graphic of hAMSCs co-cultured with PBMCs activated with anti-CD3, anti-CD28, anti-CD40, and anti-BCR, with Transwell (hAMSCs-aPBMCs W TRW). (E) Proliferation index of PBMCs. Data are means ± SD. *p < 0.05 vs. unstimulated PBMCs. P.I., proliferation index; bar = 1,000 μm.

