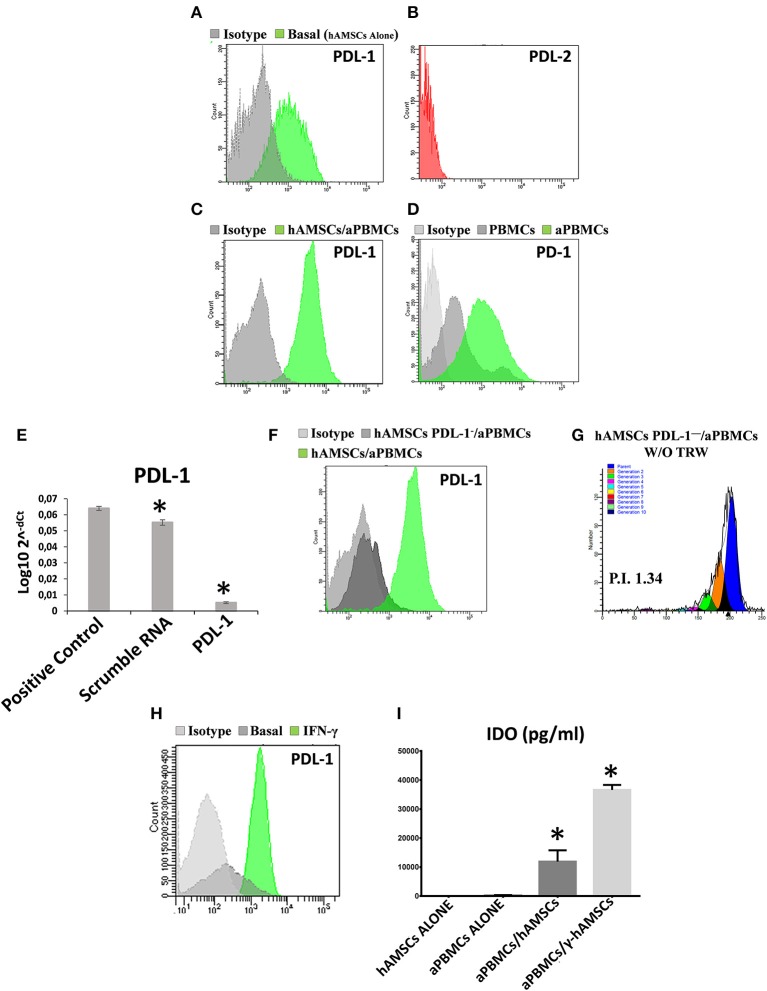
Figure 5.
Analysis of both PDL-1 and PD-1 expression in hAMSCs and PBMCs, analysis of PDL-1 in hAMSCs PDL-1− and IDO production analysis. (A) Representative FACS graphic of PDL-1 expression in hAMSCs grown alone (hAMSCs alone). (B) Representative FACS graphic of PDL-2 expression in hAMSCs grown alone. (C) Representative FACS graphic of PDL-1 expression in hAMSCs grown in co-cultures with PBMCs activated with anti-CD3, anti-CD28, anti-CD40, and anti-BCR (hAMSCs/aPBMCs). (D) Representative FACS graphic of PD-1 expression in PBMCs grown alone. (E) Expression of PDL-1 in hAMSCs after PDL-1 silencing. (F) Representative FACS graphic of PDL-1 expression in hAMSCs with or without CD274 silencing and in co-cultures with aPBMCs. (G) FACS graphic of aPBMCs proliferation co-cultured with hAMSCs PDL-1− without Transwell. (H) Representative FACS graphic of PDL-1 expression in hAMSCs activated with IFNγ. (I) IDO expression (pg/ml) in aPBMCs co-cultured with hAMSCs activated with IFNγ (γ-hAMSCs). Data are means ± SD. *p < 0.05 vs. positive control (E) or hAMSCs alone (I). P.I., proliferation index.

