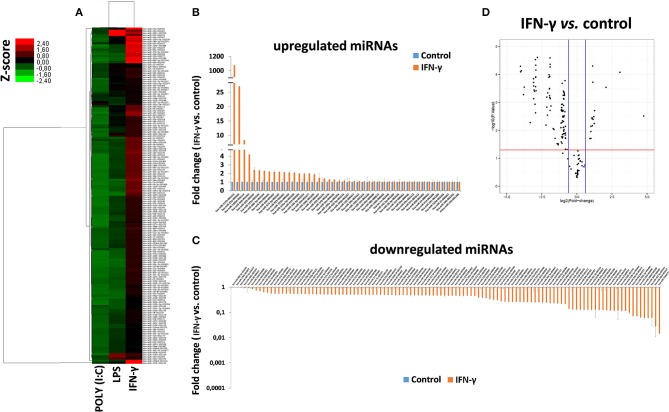
Figure 8.
Differentially expressed miRNAs in EXO derived from hAMSCs. (A) Hierarchical clustering based on Z ratios (calculated as described in the Materials and Methods section) of miRNA expression levels in EXO derived from hAMSCs treated with poly (I:C), LPS, and IFNγ. (B) Upregulated miRNAs in EXO derived from hAMSCs treated with IFNγ. (C) Downregulated miRNAs in EXO derived from hAMSCs treated with IFNγ. (D) Volcano plot analysis of deregulated miRNAs in EXO derived from hAMSCs treated with IFNγ (p ≤ 0.05 and fold change ≥ 1.5). miRNA levels were normalized to those of U6, and expressed as fold change vs. untreated cells (control). Data are means ± SD.

