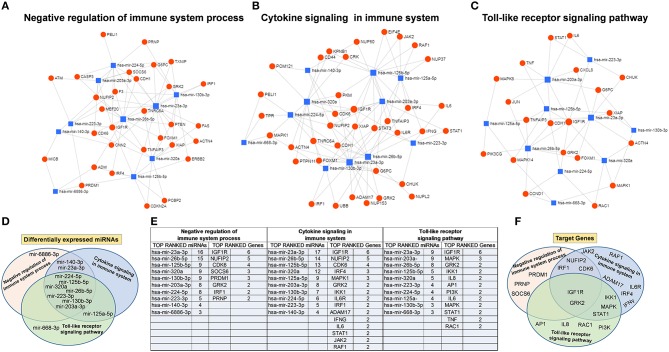
Figure 9.
Protein–protein interaction network generated for shared miRNA target genes after miRNET analysis. Only genes targeted by at least two differentially expressed miRNAs are shown. Upper images show networks with all interactions between deregulated miRNAs and genes involved in (A) negative regulation of immune system process, (B) cytokine signaling in immune system, and (C) toll-like receptor signaling pathway. (D) Distribution of the top-ranked deregulated miRNAs in the three analyzed pathways. (E) Table summarizing both the top-ranked miRNAs and the top-ranked genes showed in the network analysis. (F) Distribution of the top-ranked target genes in the three analyzed pathways.

