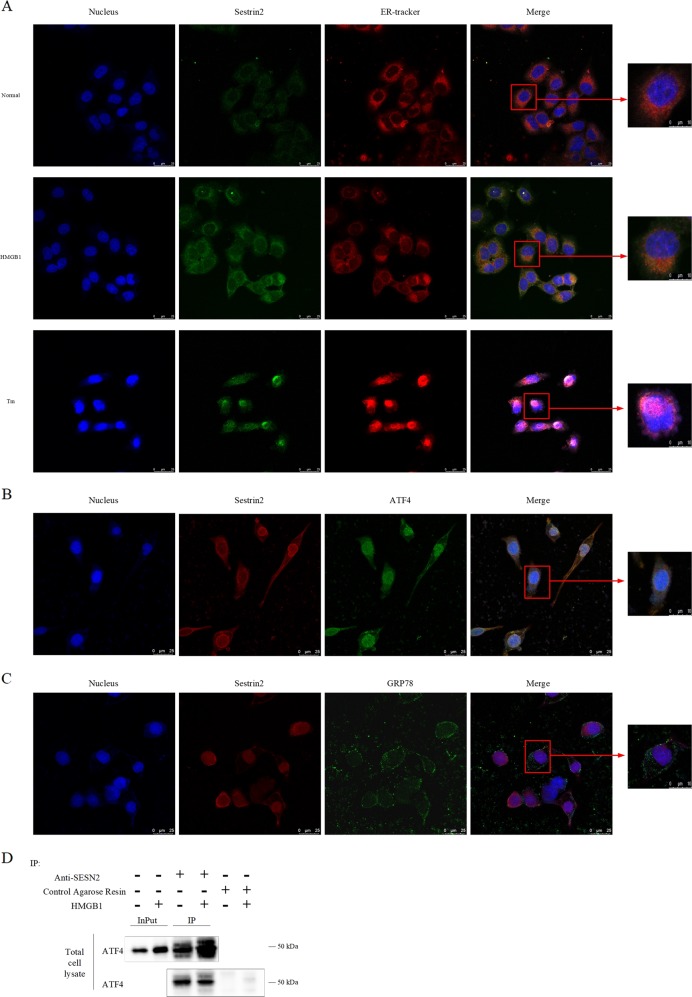
Fig. 4. Co-localization of SESN2 and ER in DC2.4 cells (×600, ×1200).
a Laser scanning confocal microscopy was used to observe SESN2 and ER in DC2.4 cells. It was shown by anti-SESN2 antibodies (green) and ER tracker (red) using indirect immunofluorescence and confocal microscopy. b It was observed by anti-SESN2 antibodies (red) and ATF4 (green) using indirect immunofluorescence and confocal microscopy. c It was shown by anti-SESN2 antibodies (red) and GRP78 (green) using immunofluorescence and confocal microscopy. d Immunoblot analysis of ATF4 in SESN2 was immunoprecipitated in total cell lysate. Negative control was using control agarose resin. Scale bar = 25 μm, scale bar = 10 μm, n = 3 per group. Its co-localization was shown in saffron yellow (DAPI stained nucleus, blue).

