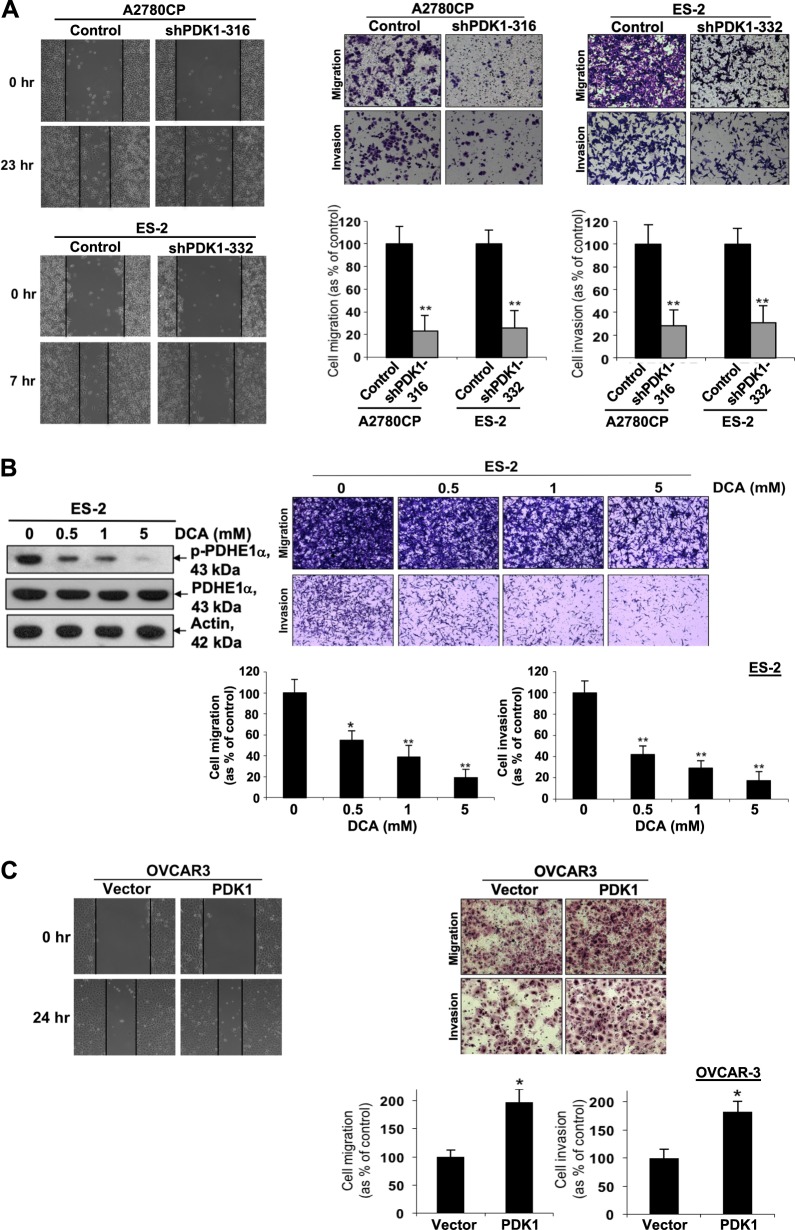
Fig. 3. PDK1 contributes to cell migration and invasion.
a Left: Wound-healing assay with A2780CP and ES-2 cells (control and stable knockdown of PDK1). Cells seeded in six-well plates for 24 h were wounded with a sterile pipette tip, followed by the addition of fresh culture medium. Images were obtained at the same wound position at time 0 and 7 (for ES-2) or 23 h (for A2780CP). Right: Cells were plated in the medium on the upper side of a transwell chamber and allowed to migrate through an 8-µm pore size membrane or invade a Matrigel-coated membrane toward lower chamber with medium plus 10% FBS (as a chemoattractant). After 12–48 h, cells on the upper compartment of the membrane were removed, and migrated or invaded cells were fixed, stained, and counted. Migration or invasion of A2780CP (shPDK1-316) and ES-2 cells (shPDK1-332) with stable knockdown of PDK1 presented as a percentage of controls; Bars: mean ± SD of three experiments; **P < 0.005, Mann–Whitney test. Representative images of migrating or invading A2780CP and ES-2 cells (upper). b Left: p-PDHE1α and PDHE1α protein expression in DCA-treated and control ES-2 cells determined via immunoblot analysis Right: Migration or invasion of DCA-treated and control ES-2 cells presented as a percentage of controls; Bars: mean ± SD of three experiments; **P < 0.005, Mann–Whitney test. Representative images of migrating or invading ES-2 cells (upper). c Left: Wound-healing assay performed on control and PDK1-overexpressing OVCAR-3 cells. Right: In vitro migration and invasion assays performed using control and PDK1-overexpressing OVCAR-3 cells. Representative images of migrating or invading OVCAR-3 cells (upper). Cell migration or invasion presented as a percentage of controls; Bars: mean ± SD of three experiments; *P < 0.05, **P < 0.005, Mann–Whitney test.

