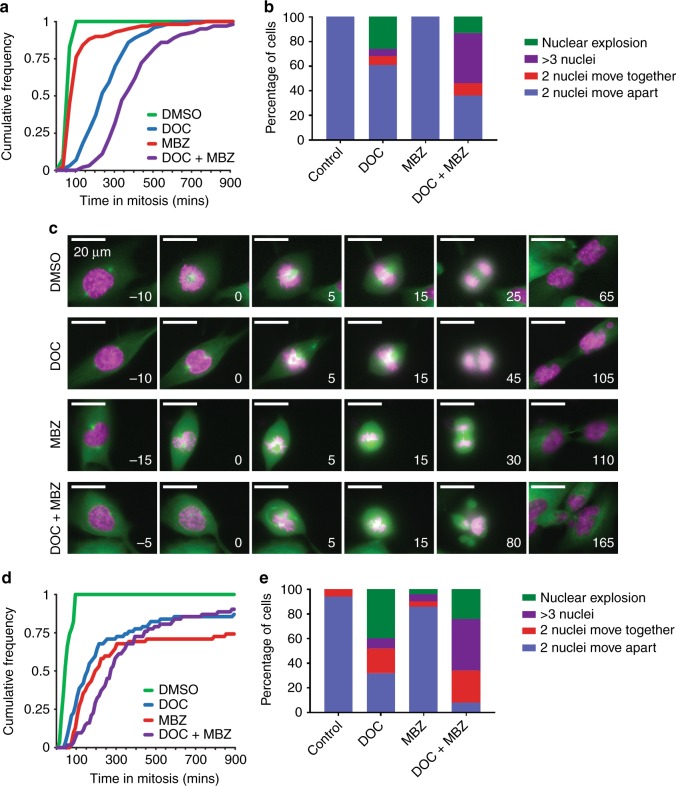
Fig. 5. Combination treatment extends mitotic delay and leads to aberrant mitosis.
a Cumulative frequency plot showing time spent in mitosis (from chromosome condensation to anaphase) for RPE1 H2B-RFP cells treated with the indicated drugs (2 nM docetaxel, 200 nM mebendazole). One hundred cells per condition were analysed. The median distributions are significantly different from each other at 95% confidence (Mann–Whitney U test). b RPE1 H2B-RFP cells treated with the indicated drugs (100 cells per condition) were analysed for mitotic outcome. The percentage of daughter cells in each of four categories was calculated. c Mitotic progression of RPE1 GFP-tubulin cells stained with 0.5 µM SiR-DNA (pink) and treated with the indicated drugs. Time is shown in minutes relative to nuclear envelope breakdown (time shown at the right bottom corner of each image; range −5 to + 165 min; treatment at 0 min). d Cumulative frequency plot showing time spent in the mitosis (from chromosome condensation to anaphase) for PC3 cells treated with the indicated drugs (2 nM docetaxel, 200 nM mebendazole) and stained with 0.5 µM SiR-DNA. Sixty-two cells per condition were analysed. The median distributions are significantly different from each other at 95% confidence (Mann–Whitney U test). e PC3 cells treated with the indicated drugs (50 cells per condition) and stained with SiR-DNA were analysed for mitotic outcome. The percentage of daughter cells in each of four categories was calculated.

