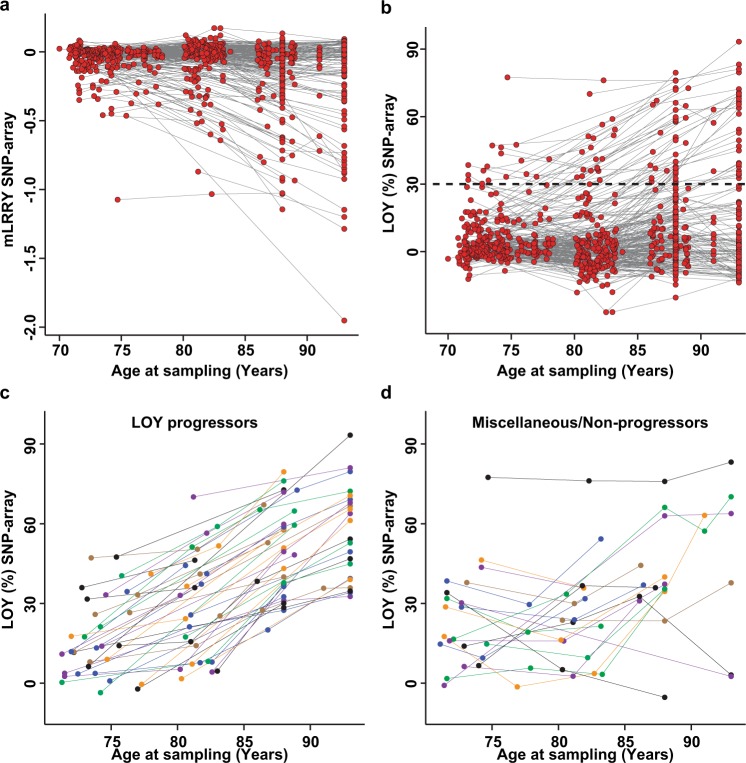
Fig. 1.
Results from longitudinal analyses of LOY mosaicism in whole blood DNA from 276 aging individuals from the ULSAM cohort. Subjects were sampled serially 2–5 times over a period of up to 22.2 years. Every point represents a measurement of LOY in a subject at one time point with the level of LOY estimated from SNP-array data at the Y-axes and age of sampling on the X-axes. The dataset before (a) and after transformation (b) of the mLRRY-values using the equation: LOY (%) = 100 × (1−22mLRRY). Grey lines connect the LOY measurements from the same individual at different time points. The dotted black line in b indicates a level of LOY mosaicism at which at least 30% of the nucleated blood cells are without a Y chromosome. This threshold was used to identify subjects displaying a high level of LOY at any time point during the study and the longitudinal changes in the frequency of LOY in this subset are displayed in c and d. To visualise changes in LOY frequency over time, points and lines were colour-coded to connect multiple measurements from the same individual. c Displays the subjects showing a clear progression in the frequency of LOY over time and d shows non-progressing individuals with miscellaneous types of longitudinal change

