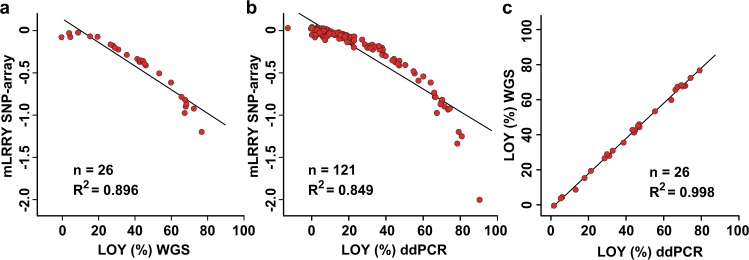
Fig. 2.
Illustration of the non-linear estimation of LOY mosaicism by mLRRY calculated from SNP-array data by comparisons with LOY estimates generated from the same set of samples using independent technologies. a, b show the comparisons between mLRRY calculated from SNP-array data with the corresponding LOY estimates generated from the pairwise studied samples using whole genome sequencing (WGS) and droplet digital PCR (ddPCR), respectively. c displays a high concordance between estimates of LOY in samples pairwise studied with WGS and ddPCR. A linear regression line with Pearson’s coefficient of determination (R2) is shown for each comparison

