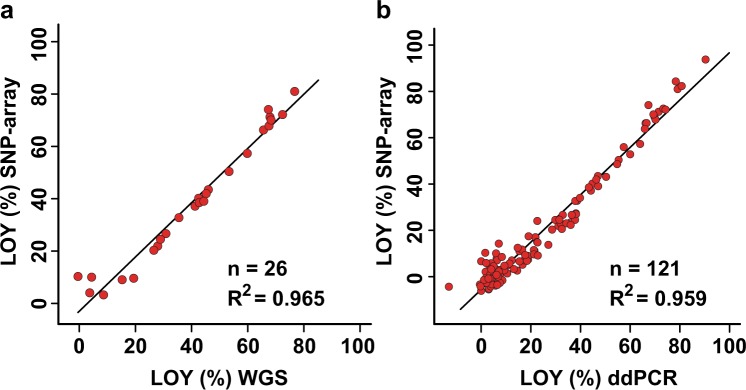
Fig. 3.
Transformation of mLRRY-values linearises LOY estimates from SNP-array data using the equation: LOY (%) = 100 × (1−22mLRRY). a displays estimations of the level of LOY from 26 pairwise studied samples using SNP-array and whole genome sequencing (WGS). The Y-axis show the predicted LOY (%) from SNP-array data using the above formula and the X-axis display the measured level of LOY using WGS. A linear regression line with Pearson’s coefficient of determination (R2) is shown. b shows a corresponding comparison between estimations of LOY from 121 pairwise studied samples using SNP-array and droplet digital PCR (ddPCR)

