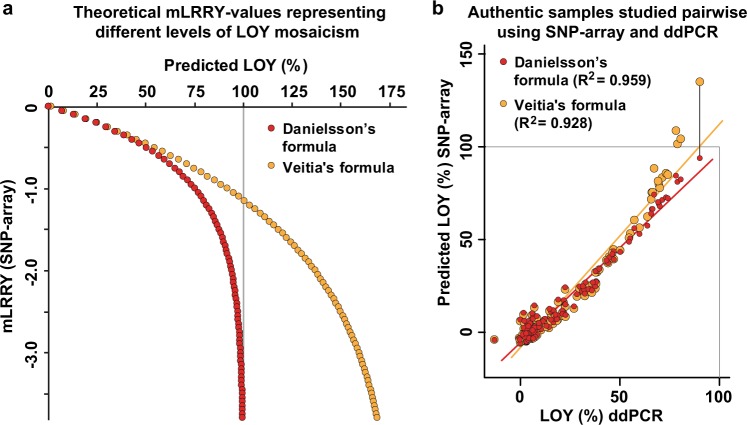
Fig. 4.
Comparison of the performance of two formulas developed for prediction of percentage of LOY from mLRRY-values, i.e. Danielsson’s formula presented here and the recently published Veitia’s formula. In a, the estimates of mosaicism from each formula are compared in a range of theoretically possible mLRRY-values representing varying degree of LOY. The values of mLRRY plotted on the Y-axis were used to predict the percentages of LOY plotted on the X-axis. In male subjects without LOY, mLRRY-values are close to zero and lower values indicate increasing level of LOY mosaicism. The mLRRY calculated from female samples typically range −3 to −4. The horizontal grey line at 100% represents an extreme level of mosaicism (Y loss in all cells) and thus indicates a maximum theoretical limit of predicted LOY mosaicism in men. b shows a similar comparison using authentic data generated from 121 samples studied with both SNP-array and ddPCR. The Y-axis shows the predicted percentage of LOY from SNP-array data using each formula and the level of mosaicism measured by ddPCR in corresponding samples are plotted on the X-axis. Grey lines indicate theoretical upper limits of LOY estimations. To illustrate the overestimation of LOY mosaicism generated by the Veitia’s formula, a black line connects the predictions from each formula in the sample with the highest level of LOY mosaicism

