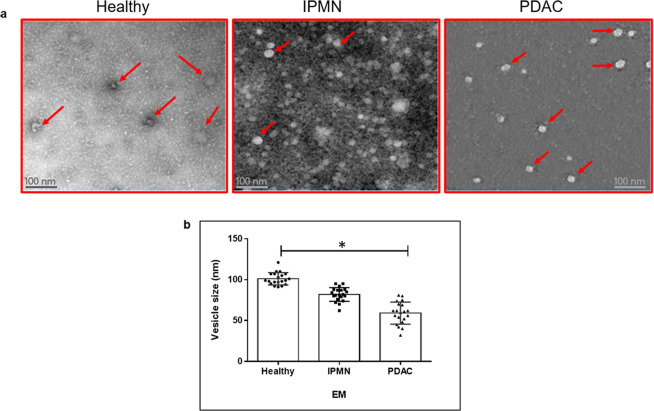
Figure 2.
Ultrastructure analysis of exosomes in healthy, IPMN and PDAC serum by TEM. Exosomes were separated from serum samples using ExoquickTC, and subsequently purified by gel exclusion chromatography mentioned in methods. The samples were prepared for TEM and negative staining (n = 3 each). Images were acquired using JEOL JEM 1400 at 120 kV on a Gatan Ultrascan 1000 CCD. Red arrows depict exosomes. (a) Exosome vesicles in serum samples (n = 3 each) from healthy, IPMN and PDAC were measured (twenty vesicles/sample) randomly for their size distribution, and the median values are depicted. Vesicle size were lower in PDAC compared to healthy serum samples (*p = 0.032) (b).

