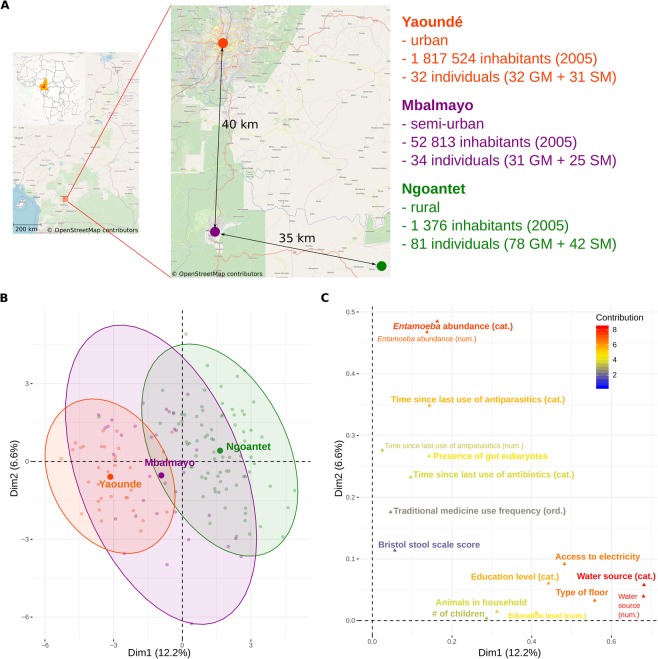
Figure 1.
Description of the urbanization gradient. (A) Map of the sampling area96 and sampling design; numbers in brackets show the number of gut (GM) and saliva (SM) microbiomes included in the analysis. FAMD (Factor analysis of mixed data) of non-dietary contextual information showing (B) individuals colored by urbanization level (rural, semi-urban, urban) and (C) variables that significantly contributed to the construction of depicted axes; ordered factors were coded both as numerical (num.) and categorical (cat.) variable. Corresponding plots showing the 1st and the 3rd axis and the ordinations based on dietary can be found in Supplementary Figs. 1–3.

