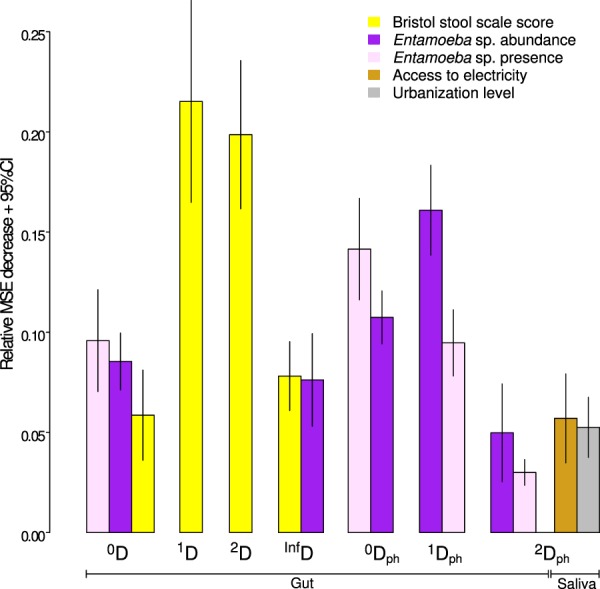
Figure 3.

The most important predictors of ASV diversity for the gut and saliva microbiome selected by random forest regression. The values represent the means of 10 model replicates. Depicted variables were selected by kmeans clustering of the variable importance values as described in Methods section, only for the models with R-squared > 0.1. Both non-phylogenetic (D) and phylogenetic (Dph) diversity indices are shown. The order (0, 1, 2 and Inf) represents the weight given to taxa abundances. Detailed description of diversity indices can be found in Table 1 and Methods. Corresponding plots showing the alpha diversity predictors for the rural-urban data subsets can be found in Supplementary Fig. 4. Complete results are in Supplementary Table 3.
