Fig. 5.

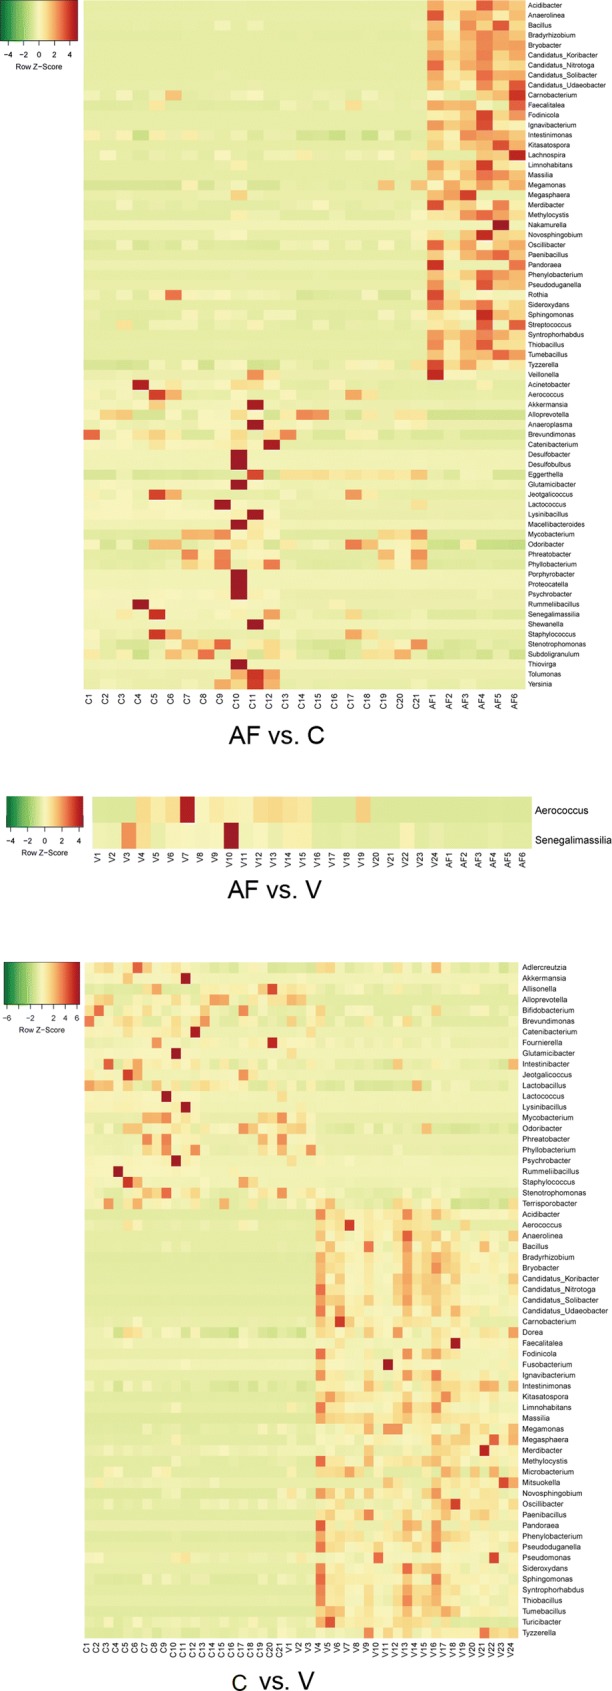
Visualized heatmaps of the differential microbiota (genus level) among acute fatty liver group (AF), constipation group (C) and excessive vomiting (V group). Red indicates high relative abundance, and green indicates low relative abundance

Visualized heatmaps of the differential microbiota (genus level) among acute fatty liver group (AF), constipation group (C) and excessive vomiting (V group). Red indicates high relative abundance, and green indicates low relative abundance