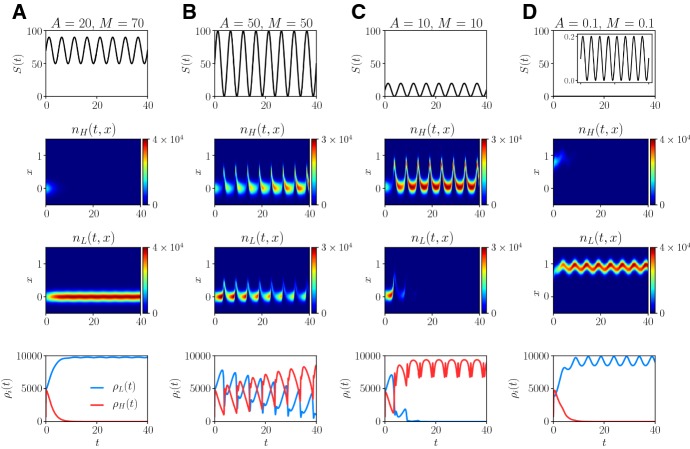
Fig. 5.
a Plots of the nutrient concentration S(t) (first row), the phenotype distributions (second row) and (third row), and the population sizes (fourth row, red line) and (fourth row, blue line) obtained by solving numerically the system of PDEs (3), where S(t) is defined according to (79) with , and . The values of the model parameters are defined as in Table 1 with . b–d Same as column a but for (column b), (column c), and (column d) (color figure online)

