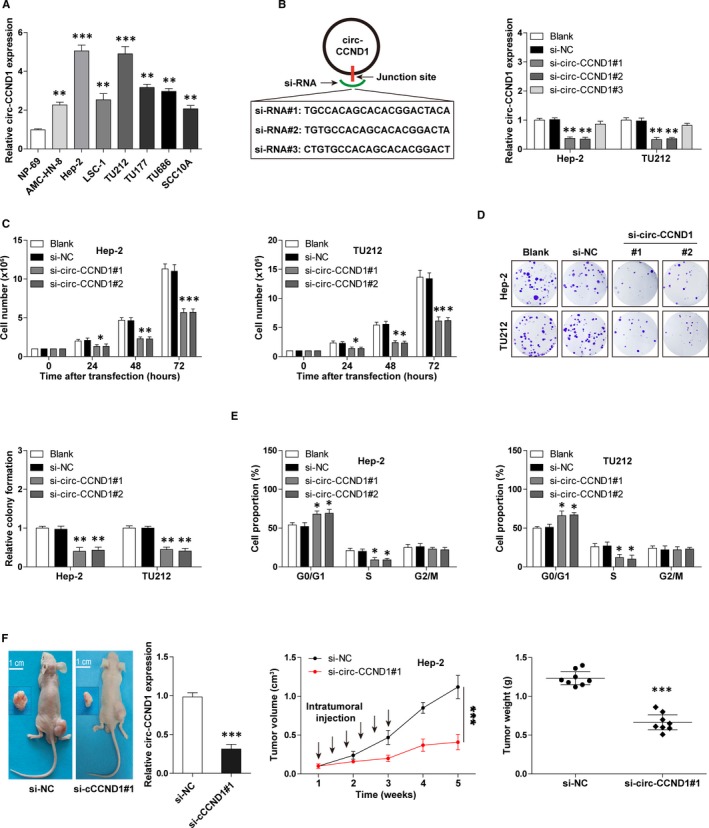
Figure 2.

Silencing of circ‐CCND1 retards LSCC cell growth both in vitro and in vivo. A, qRT‐PCR analysis for circ‐CCND1 expression in LSCC cell lines. B, The diagram showing three designed siRNAs targeting the junction site of circ‐CCND1 (left). qRT‐PCR analysis verifying the knockdown efficiency of si‐circ‐CCND1#1 and #2 (right). C, The cell number counted at the indicated time after circ‐CCND1 depletion. D and E, The colony formation and cell cycle assays in circ‐CCND1‐depleted Hep‐2 and TU212 cells. F, The representative image showing the nude mice bearing tumours injected with cholesterol‐coupled control or si‐circ‐CCND1, the expression levels of circ‐CCND1 and the volume and weight of subcutaneous tumours in each group were analysed. * P < .05, ** P < .01, *** P < .001
