Figure 2.

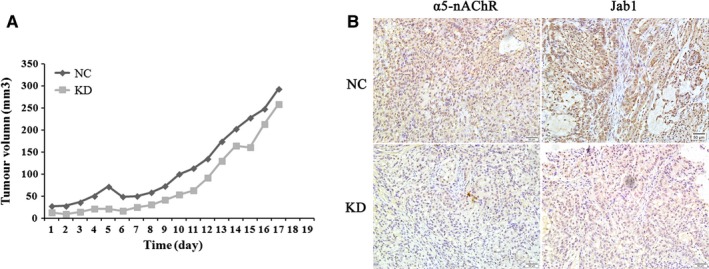
α5‐nAChR and Jab1 expressions in NSCLC tumour xenografts. A, Representative images of harvested tumours (top) and the corresponding tumour growth curves (bottom) are shown. B, The expression of α5‐nAChR and Jab1 in α5‐nAChR knockdown xenografts (KD) and control cells' xenografts (NC) was determined by immunohistochemistry, 200×, scare bar, 50 µm
