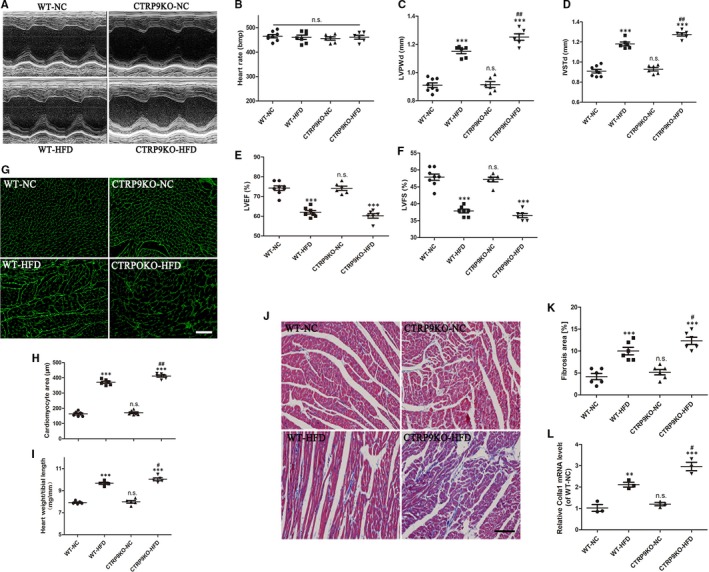
Figure 3.

CTRP9 knockout aggravated HFD‐induced myocardial hypertrophy and fibrosis. A, Representative echocardiographic images in WT and CTRP9KO mice fed normal chow (NC) or high‐fat (HF) diet for 26 wks. B, C, D, E and F, Heart rate (B), LVPWd (C), IVSTd (D), LVEF (E) and LVFS (F), echocardiographic analysis. G and H, Representative WGA staining (40×, bar = 30 µm) of cardiac tissues and quantification of cardiomyocyte cross‐sectional area. I, The statistical analysis of the ratio of heart weight‐to‐tibial length. J and K, Representative massion staining (20×, bar = 50 µm) and quantification of cardiac fibrosis. L, colla1 expression measured by RT‐PCR. Mean ± SEM, n = 5‐8 mice per group, *** P < .001 vs respective NC group; # P < .05, ## P < .01, vs WT‐HFD group; n.s. P > .05 vs WT‐NC group
