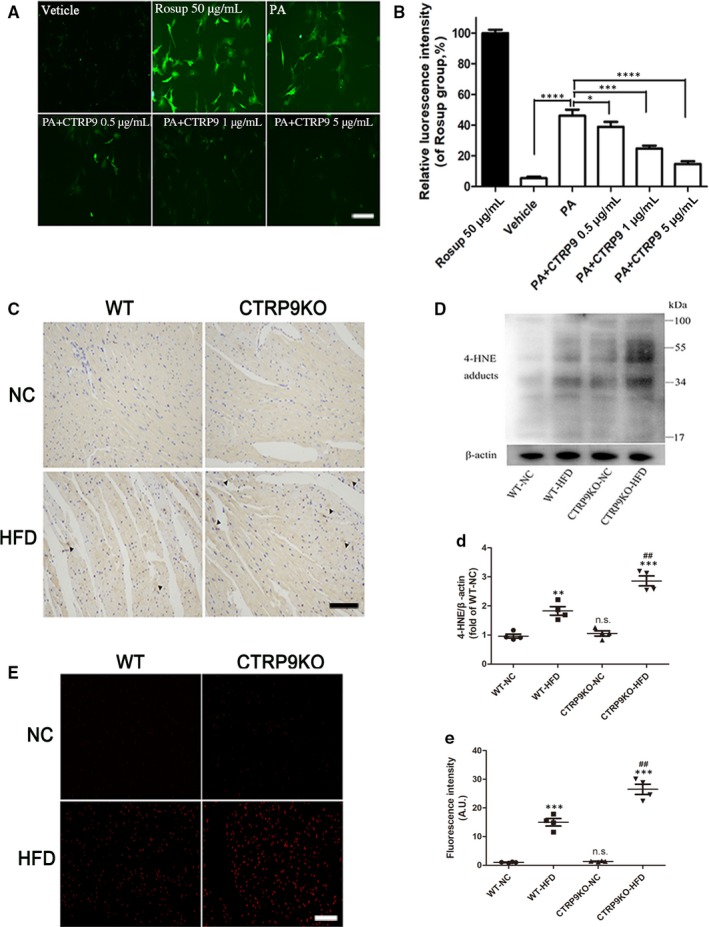
Figure 6.

CTRP9 deficiency exacerbated oxidative stress in the heart of HFD‐fed mice. A‐B, The ROS levels in NRCMs treated with palmitate (400 µmol/L) for 12 h after pre‐incubation with exogenous CTRP9 for 6 h were evaluated by fluorescence microphototographs (10×, bar = 200 µm) and related statistical analysis for the green fluorescence intensities. CTRP9 0.5, 1 and 5 µg/mL were used in the study. Rosup was used as a ROS positive control. Mean ± SEM, n = 4‐6 per group, * < 0.05, ** P < .01, *** P < .001, *** P < .0001. C, Representative immunohistochemical staining for 4‐HNE (20×, bar = 50 µm). Oxidative stress damage sites (dark brown) were marked by black triangular arrow. D and d, Representative images of Western blotting for 4‐HNE and quantifications by densitometric analysis. β‐actin was used as a loading control. E and e, Representative images of DHE staining (10×, bar = 100 µm) and fluorescence intensity analysis. Mean ± SEM, n = 4 per group, * < 0.05, *** P < .001, vs respective NC group, n.s., not significant vs WT‐NC group. AU indicates arbitrary unit
