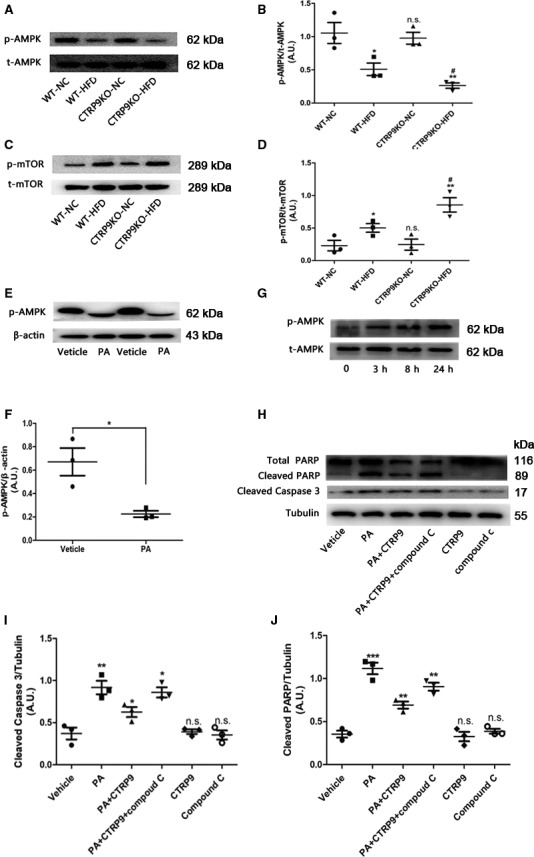
Figure 7.

AMPK phosphorylation is weakened in HFD‐fed CTRP9 knockout mice and palmitate‐treated NRCMs. B, Representative images of Western blotting for p‐AMPK and t‐AMPK (A) and quantifications by densitometric analysis (B) of WT or CTRP9KO mice fed NC or HF diet. Mean ± SEM, n = 4 per group, * P < .05, ** P < .01, vs respective NC group; # P < .05, vs WT‐HFD group; n.s., not significant vs WT‐NC group. C‐D, Representative images of Western blotting for p‐mTOR and t‐mTOR and related densitometric analysis. Mean ± SEM, n = 4 per group, * P < .05, ** P < .01, vs respective NC group; # P < .05, vs WT‐HFD group; n.s., not significant vs WT‐NC group. E‐F, Representative images of Western blotting for p‐AMPK and β‐actin and the statistical analysis of the NRCMs stimulated with palmitate. β‐actin was used as a loading control. Mean ± SEM, n = 3‐5 per group, * P < .05, vs vehicle group. G, Representative images of Western blotting for p‐AMPK and t‐AMPK of the NRCMs treated with CTRP9 for 0, 3, 8 and 24 h (G). The concentration of CTRP9 was 1 µg/mL. H‐J, Representative images of Western blotting for cleaved caspase 3 and PARP (H) and respective statistical analysis (I and J). Tubulin was used as a loading control. CTRP9 1 µg/mL and palmitate 400 µmol/L were used. Mean ± SEM, n = 3‐5 per group, * < 0.05, ** P < .01, *** P < .001, vs left adjacent group, n.s., not significant vs vehicle group.AU indicates arbitrary unit
