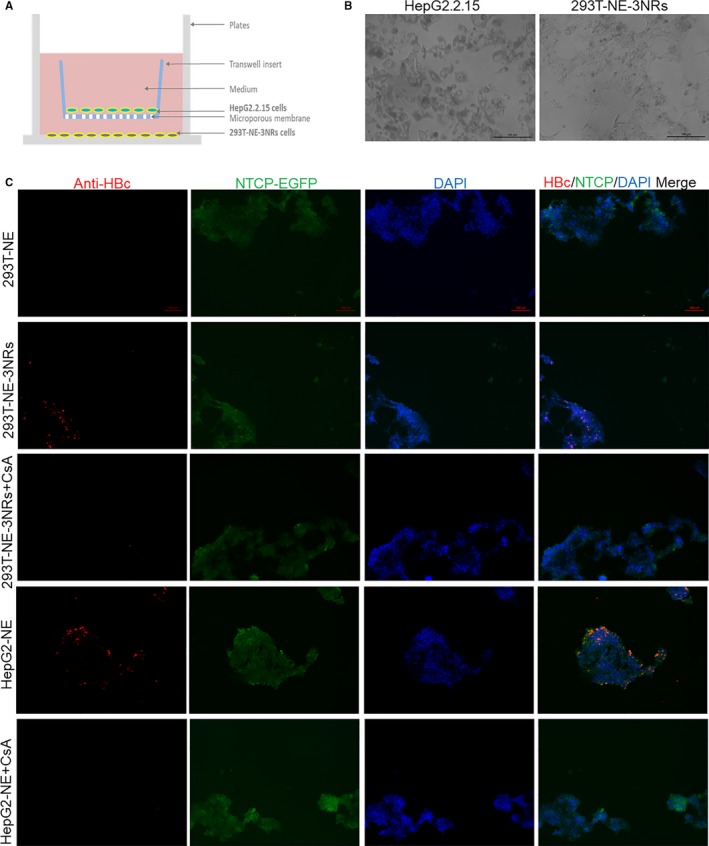
Figure 6.

293T‐NE‐3TFs cells are susceptible to HBV infection when co‐cultured with HepG2.2.15 cells. (A) Schematic diagram of the co‐culture 293T‐NE‐3NRs and HepG2.2.15. (B) Cell morphology was observed by microscopy, scale bar = 100 μm. (C) Cells were fixed in −20°C methanol at 10 d post co‐culture. Then, HBcAg was determined by immunofluorescence. CsA, cyclosporine A
