
Figure 6.
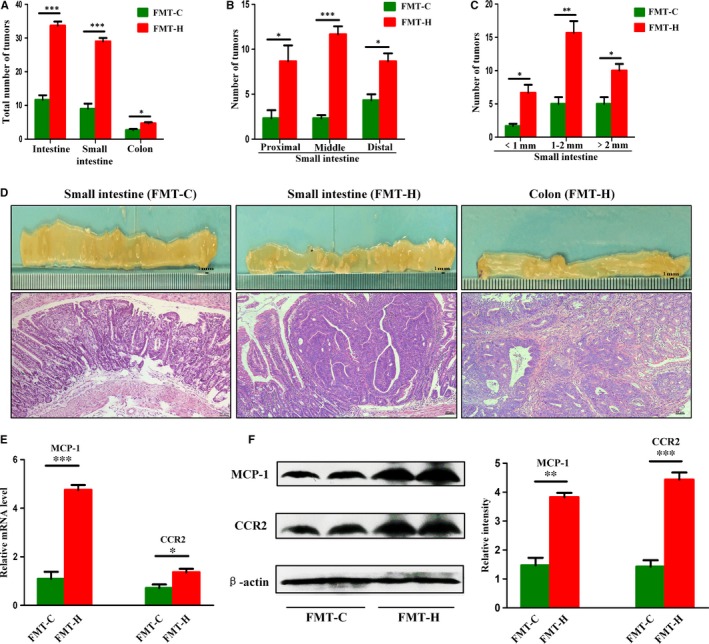
Faecal microbiota from high‐fat diet‐treated Apcmin/+ mice activated MCP‐1/CCR2 axis and accelerated carcinogenesis. A‐C, Tumour numbers in both groups after FMT. D, The representative gross and histological appearance of intestinal tumours in both groups. E‐F, The expression levels of MCP‐1 and CCR2 in small intestine tumours of FMT‐H group were significantly higher than those in FMT‐C group. Scale bar: 50 μm. *P < .05, **P < .01, ***P < .001. FMT‐C, n = 4; FMT‐H, n = 4