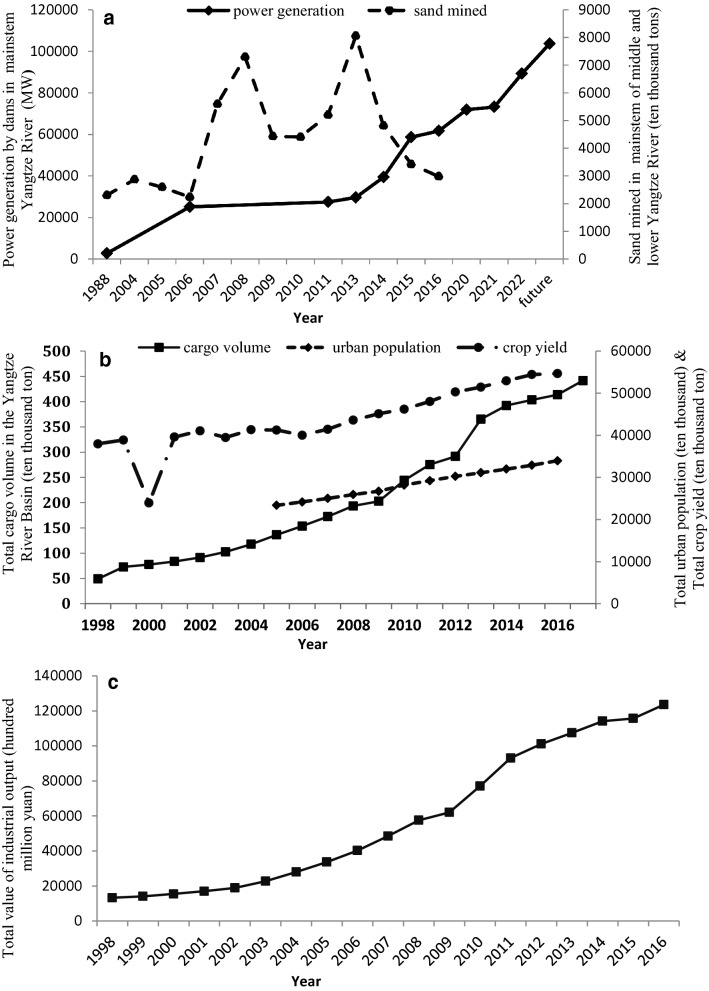
Fig. 6.
Trends of total annual a power generations by mainstem dams and sand mined in the middle and lower mainstem, b cargo volume, urban population and crop yield, and c value of industrial output in the Yangtze River Basin.
Data sources: China Ministry of Water Resources or MWR (http://www.mwr.gov.cn/); China Ministry of Transport or MOT (http://www.mot.gov.cn/); China Ministry of Natural Resources or MNR (http://www.mnr.gov.cn/); and China National Bureau of Statistics or NBS (http://www.stats.gov.cn/)

