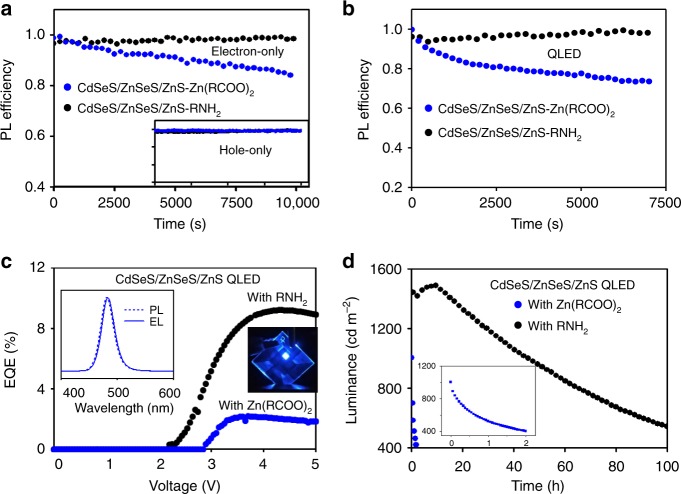
Fig. 5. Electrochemical stability and QLED performance of the blue-emitting QDs.
a Relative PL efficiency of the QDs in the electron-only devices (ITO/TPBi (~25 nm)/QDs (~20 nm)/Zn0.9Mg0.1O (~50 nm)/Al) driven at a constant current density of 100 mA cm−2. Inset, the relative PL efficiency of the QDs in the hole-only devices (ITO/PEDOT:PSS (~35 nm)/poly-TPD (~30 nm)/PVK (~5 nm)/QDs (~20 nm)/CBP (~25 nm)/MoOx/Au) driven at a constant current density of 30 mA cm−2, which shares the same coordinate axes with the main plot. b Relative PL efficiency of the QDs in the QLEDs (ITO/PEDOT:PSS (~35 nm)/poly-TPD (~30 nm)/PVK (~5 nm)/QDs (~20 nm)/Zn0.9Mg0.1O nanocrystals (~50 nm)/Al, driven at a constant current density of 100 mA cm−2). c EQE vs. driving voltage of the blue-emitting QLEDs. Insets, PL and EL spectra and a photograph of a working QLED, respectively. d Stability data of the blue-emitting QLEDs driven at the constant-current mode. Inset: expanded plot for the QLEDs with the CdSeS/ZnSeS/ZnS-Zn(RCOO)2 QDs.

