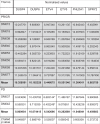
Table 1.
Expression of individual genes in the MEK 6 gene score in melanomas of patients treated with docetaxel plus selumetinib.
 |
Grey shaded rows: patients with PR/CR to docetaxel plus selumetinib combination treatment; unshaded rows: patients with PD at first assessment.
Mean gene expression in both groups was compared using Student’s t test with two-tailed distribution.
aCases where ETV4 expression was below the set limit of detection (mean minus two standard deviations), so accuracy is unclear. Bold values are the mean figures for the gene expression values per gene in each group.
