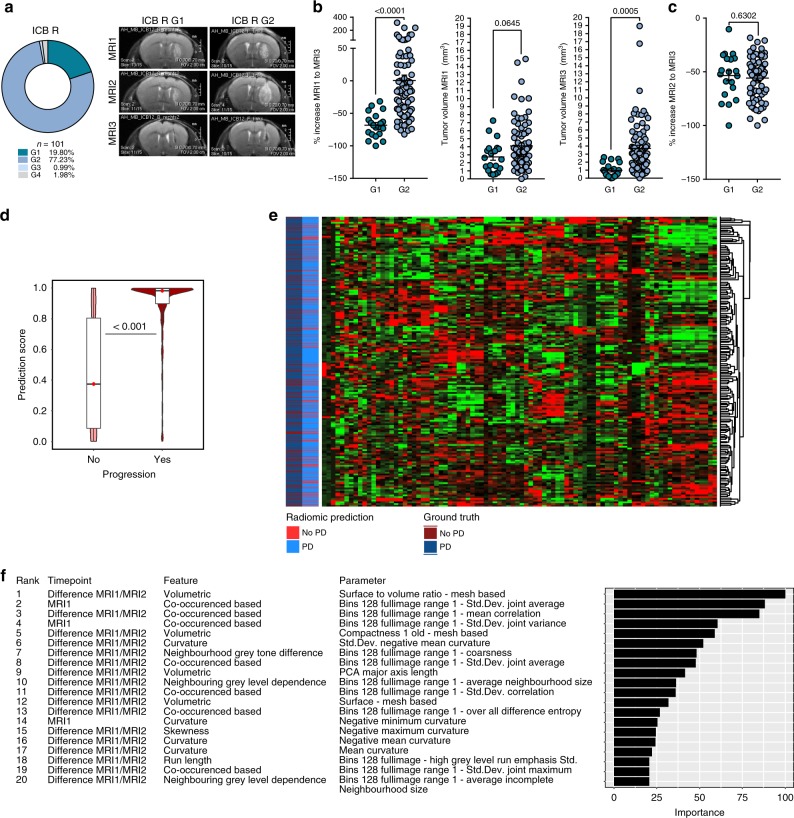
Fig. 2. Radiomic prediction of therapy response to ICB therapy.
a–c C57Bl/6 J mice were treated with 250 µg anti-PD-1 and 100 µg anti-CTLA-4 (ICB+) and tumor growth, therapy response and pseudoprogression were evaluated by MRI before (MRI1), during (MRI2), and after ICB therapy (MRI3). a Growth pattern analysis of ICB R (n = 101 animals). G1: %VMRI2–MRI1 < 0% and %VMRI3–MRI2 < 0%; G2: %VMRI2–MRI1 > 0% and %VMRI3–MRI2 < 0%; G3: %VMRI2–MRI1 > 0% and %VMRI3–MRI2 > 0%; and G4: %VMRI2–MRI1 < 0% and %VMRI3–MRI2 > 0%. b %VMRI3–MRI1 (left), VMRI1 (baseline tumor volume; middle), and VMRI3 (final tumor volume; right) of ICB R mice with growth pattern G1 and G2 (G1 n = 20 vs. G2 n = 78 animals). c %VMRI3–MRI2 of ICB R mice with growth pattern G1 and G2 (G1 n = 20 vs. G2 n = 78 animals). d–f Radiomic response prediction after ICB therapy based on radiomic features of MRI1 (baseline) and MRI2 (during ICB therapy) images (n = 148 animals). Boxplot with blocks showing the interquartile range (IQR) of data points and horizontal central line (red dot) corresponding to the median. The superimposed violin plot visualizes the distribution of the data and its probability density. Radiomic signature score d, heatmap of radiomic features e, and top predictive radiomic features f of R and NR tumors based on radiomic features of MRI1 and MRI2. Data are presented as mean ± SEM for b and c. Statistical significance was determined by two-tailed Student’s t-test for b–d. Source data are provided as a Source Data file.

