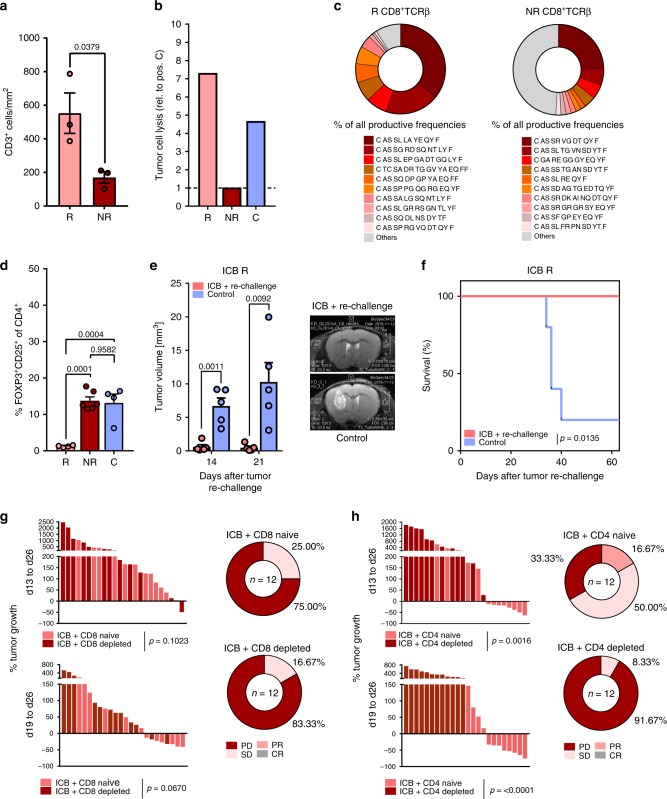
Fig. 3. Impaired antitumor T cell immunity in ICB NR tumors.
C57Bl/6 J mice were treated with 250 µg anti-PD-1 and 100 µg anti-CTLA-4 (ICB + ), or isotype control (C) on d13, d16, and d19 and tumor monitoring was performed on d13, d19, and d26 post tumor inoculation. a CD3+ cell counts per mm² tumor area assessed by immunohistochemistry (ICB R n = 3, ICB NR n = 3 animals). b CD3+ TILs were isolated by MACS from ICB R, ICB NR, and C tumors on d27 and incubated for 4 h with Gl261 cells ex vivo. Cytotoxicity was analyzed by LDH release relative to positive lysis control (ratio). Five samples per group were pooled. Values are corrected for spontaneous effector and target cell LDH release. c Representative ICB R and ICB NR CD8+ TCRβ TIL repertoire and % of ten most frequent sequences. d Flow cytometry for frequency of CD25+FOXP3+ Tregs of CD4+ TILs (ICB R n = 4, ICB NR n = 6, C n = 4 animals). e, f C57BL/6 J mice were treated with ICB on d14, d17, and d20 after Gl261 injection and tumors were measured on d14, d21, d29, d42, and d50. Gl261 rechallenge of ICB R was performed on d57 after first tumor injection. Tumor volumes on d14 and d21 after rechallenge e and survival f of Gl261 rechallenged ICB R and control-injected mice (n = 5 vs. n = 5 animals). g, h CD8+ or CD4+ T cells were depleted prior and during ICB using monoclonal depletion antibodies (4 × 500 µg 2.43 or 2 × 1000 µg GK1.5). g ICB response in CD8+-depleted or naive mice (ICB + CD8 naive n = 13, ICB + CD8 depl. n = 13 animals) and h in CD4 depleted or naive mice (ICB + CD4 naive n = 12, ICB + CD4 depl. n = 12 animals). Data are represented as mean ± SEM for a, d and e. Statistical significance was determined by one-way ANOVA with Tukey’s test for d, two-tailed Student’s t-test for a, e, g and h or log-rank Mantel–Cox test for f. Source data are provided as a Source Data file.

