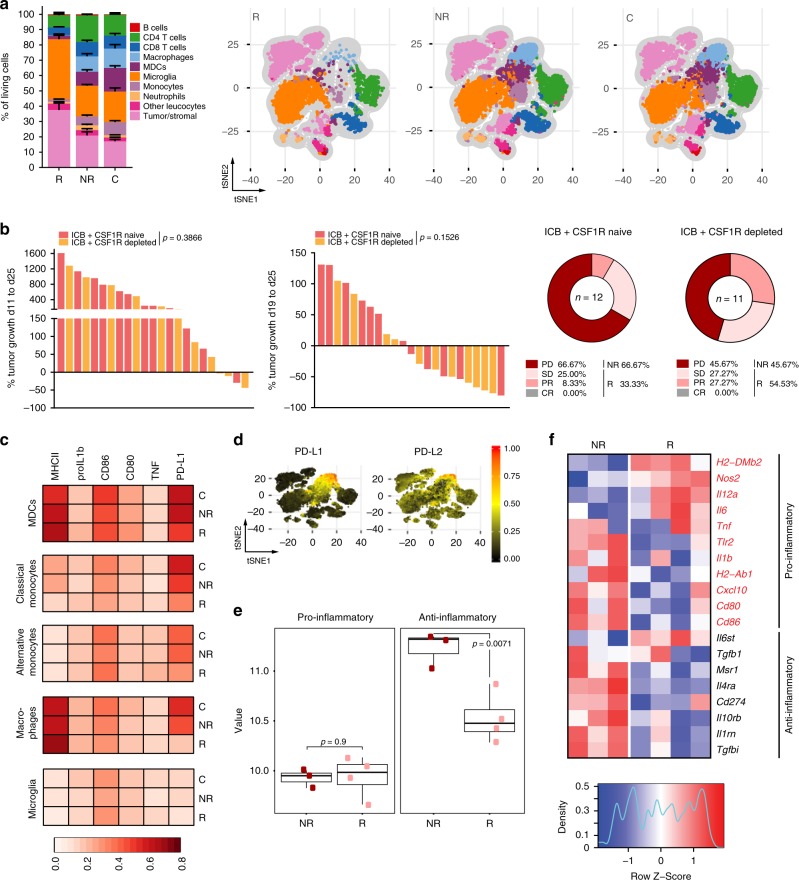
Fig. 4. Enhanced frequencies of PD-L1-expressing macrophages in ICB NR tumors.
C57Bl/6 J mice were treated with 250 µg anti-PD-1 and 100 µg anti-CTLA-4 (ICB + ), or isotype control (C) on d13, d16, and d19 and tumors were monitored by MRI on d13, d19, and d26 post Gl261 injection. a Multiparameter flow cytometry analysis of CNS samples from ICB R, ICB NR, and C on d27. (ICB R n = 5, ICB NR n = 5, C n = 5 animals). tSNE-guided immune cell subset identification using tSNE composite dimensions by multiparameter flow cytometry analysis. Relative frequencies (left) and FlowSOM-guided meta-clustering on living and single cells (right) of ICB R, NR, and C CNS tissue. b CSF1R was targeted prior and during ICB therapy using monoclonal antibodies (AFS98; 6 × 250 µg). Response to ICB therapy in CSF1R-targeted and control mice (ICB + n = 12, ICB + CSF1R depleted n = 11 animals). c Multiparameter flow cytometry analysis of CNS samples from ICB R, ICB NR, and C mice on d27. (ICB R n = 5, ICB NR n = 5, C n = 5 animals). Heatmaps showing the median expression (value range 0–1, white–red) of pro- and anti-inflammatory markers in MDCs, classical monocytes, alternative monocytes, macrophages, and microglia clusters in ICB R, NR, and C CNS tissue. d PD-L1 and PD-L2 expression on identified CNS subsets from stochastically selected cells from ICB R, ICB NR, and C CNS tissue. e, f Pro- and anti-inflammatory gene signature score (geometric mean of pro- and anti-inflammatory genes) e and gene expression of pro- and anti-inflammatory genes f in tumor-associated CD45highCD11b+ cells (macrophages) from ICB R and ICB NR assessed by NanoString analysis (ICB R n = 4, ICB NR n = 3 animals). Center line of the boxplot shows the mean and the whiskers represent the upper and lower most quartiles. Data are represented as mean ± SEM for a. Statistical significance was determined by two-tailed Student’s t-test for b and e. Source data are provided as a Source Data file.

