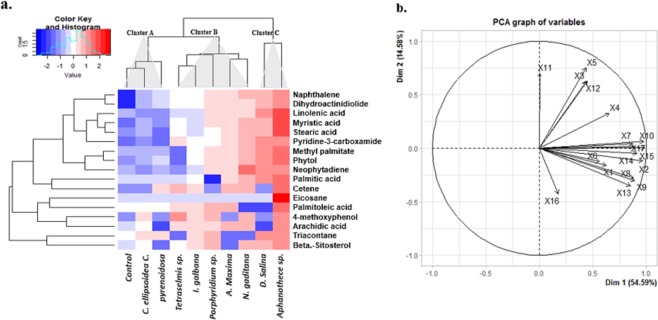
Figure 6.
Hierarchical clustering and principal component analysis (PCA) of 17 metabolites detected in high concentration in 40 day old treated and non-treated tomato plants, under laboratory conditions. The Heat-map represents the normalized mean values (centered and scaled) of leaf metabolites of three replicates. The variables included: X1 = Beta.-Sitosterol, X2 = Linolenic acid, X3 = Cetene, X4 = Eicosane, X5 = Arachidic acid, X6 = Palmitic acid, X7 = Naphthalene, X8 = Neophytadiene, X9 = Methyl palmitate, X10 = Stearic acid, X11 = Palmitoleic acid, X12 = 4-methoxyphenol, X13 = Phytol, X14 = Pyridine-3-carboxamide, X15 = Myristic acid, X16 = Triacontane, X17 = Dihydroactinidiolide. Refer to Fig. S5 for variable -treatment b-Plot and Table S6 for all metabolites detected under different treatments.

