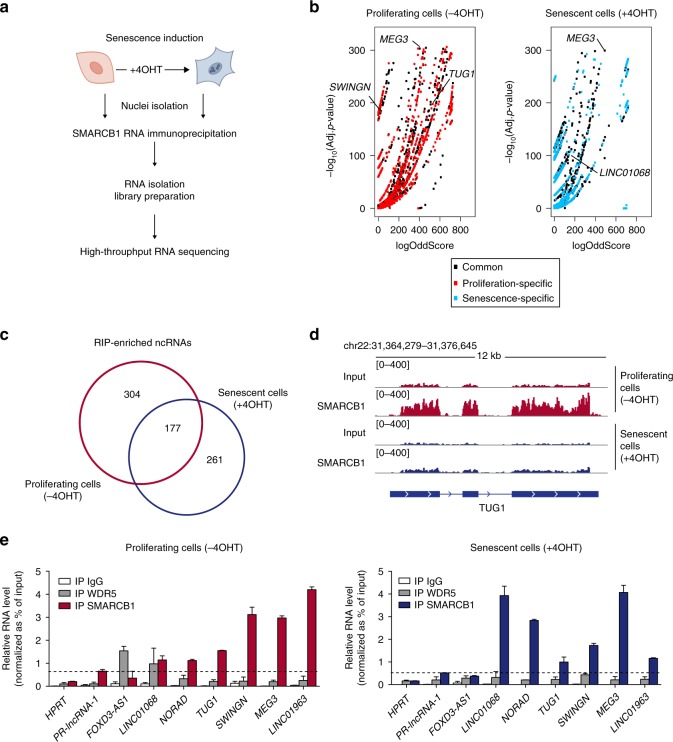
Fig. 1. SMARCB1 RIP-seq reveals differential interactions with RNA upon senescence induction.
a Schematic workflow of SMARCB1 RIP followed by high-throughput sequencing performed on proliferating BJ ER:RAS cells or induced to senescence after 6 days of OIS; n = 3 biological replicates. b Volcano plot representing enriched SMARCB1-interacting RNA molecules in proliferating (−4OHT; left panel) or senescent (+4OHT; right panel) conditions, as calculated by ripseeker package (Materials and methods). On x-axes, logOddScore values correspond to fold induction value of IP/Input while adjusted p-value (Adj. p-value) based on posterior probability is plotted on y-axes. Transcripts enriched in both conditions are represented as black dots while proliferation or senescence-specific RNAs are labeled in red or blue, respectively. c Venn diagram showing the overlap between ncRNAs (which include lincRNA, antisense, miscRNA, scaRNA, and miRNA) enriched in SMARCB1 IP in proliferating (n = 481, red-colored) and senescent conditions (n = 438, blue-colored). Significantly enriched ncRNAs were selected based on the following filters: Adj. p-value ≤ 1e−10, logOddScore > 1. d RIP-seq signal of Input and SMARCB1 IP at TUG1 genomic locus in proliferating (red color, −4OHT) and senescent (blue color, +4OHT) BJ cells. e Validation of a set of lncRNAs by SMARCB1 RIP followed by RT-qPCR. RNA enrichment in SMARCB1 IP was calculated as percentage of input, using WDR5 and IgG IPs as control. SWINGN was amplified with primer set#2. HPRT and p53-regulated lncRNA-1 (PR-lncRNA-1) are negative controls. n = 3 (n = 2 for WDR5 RIP) biological replicates shown as mean ± SD. Source data of this Figure are provided as Source data file.

