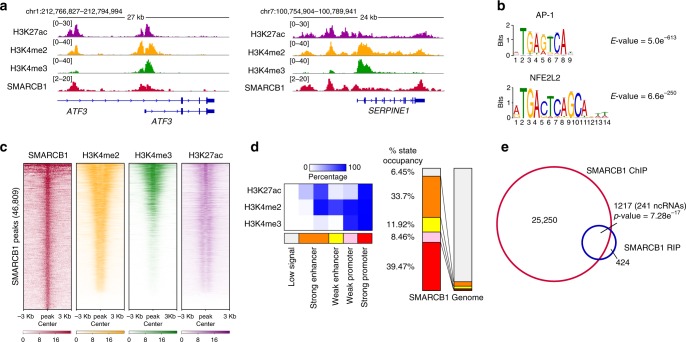
Fig. 2. Profiling of SMARCB1 genomic binding map highlights preferential binding at active, transcribed chromatin regions.
a Genomic snapshots of SMARCB1, H3K27ac, H3K4me2 and H3K4me3 ChIP-seq data at ATF3 and SERPINE1 loci in BJ proliferating cells. b Top enriched consensus motifs, as defined by MEME-ChIP motif analysis for the peaks in SMARCB1 ChIP-seq experiment in BJ cells. MEME-ChIP E-value estimates the expected number of motifs with similar features that one would find in a similarly sized set of random sequences. c Heat maps of SMARCB1, H3K4me2, H3K4me3, and H3K27ac occupancy at SMARCB1 peaks identified by SMARCB1 ChIP-seq in BJ cells. Heat maps are ranked by SMARCB1 occupancy. d Left, emissions of the chromatin state model generated by ChromHMM using histone marks ChIP-seq data in BJ cells, representing the percentage of regions assigned to a particular chromatin state (columns) containing a specific histone mark (rows). Right, distribution of the different states in the SMARCB1 binding map compared to the distribution in BJ total genome. e Venn diagram representing the overlap between genes enriched in SMARCB1 RIP in proliferating conditions (n = 1641, including 481 ncRNAs, 980 mRNAs, and 180 pseudogenes) and genes presenting a SMARCB1 ChIP peak (26467). Significance (upper cumulative p-value) has been calculated by hypergeometric test.

