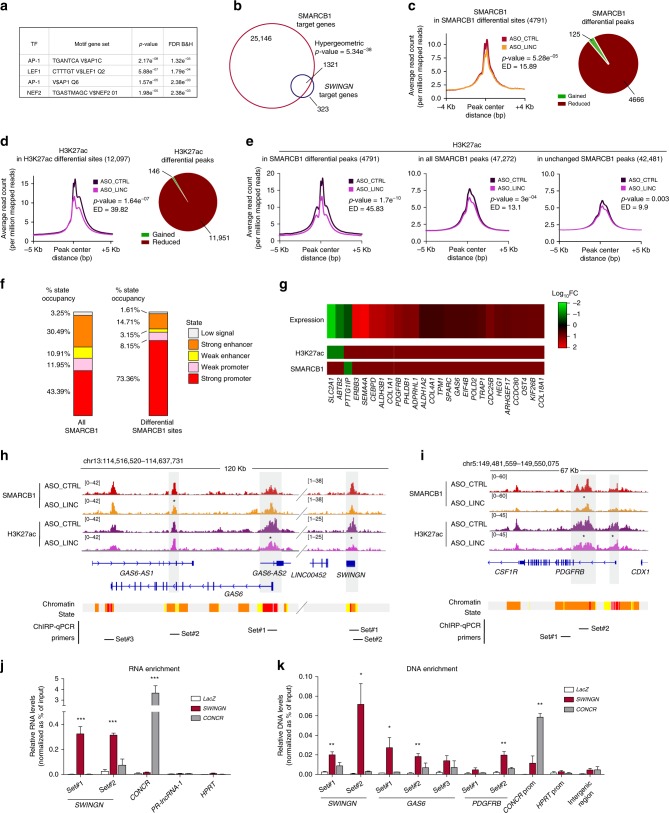
Fig. 5. SWINGN regulates gene activation at additional loci by controlling SWI/SNF activity.
a Analysis of transcription factor binding by Gene Set Enrichment Analysis across the Molecular Signatures Database for genes differentially expressed upon SWINGN knockdown. FDR is represented as Benjamini-Hochberg corrected. b Overlap between genes presenting a SMARCB1 ChIP peak and genes differentially expressed upon SWINGN depletion. Significance (upper cumulative p-value) has been calculated by hypergeometric test. c, d Metagene plot showing SMARCB1 (c) or H3K27ac (d) differential occupancy in control (ASO_CTRL) and SWINGN knockdown (ASO_LINC) (left) and pie chart illustrating the composition of the peaks (right). e Metagene plot showing H3K27ac differential occupancy in control (ASO_CTRL) and SWINGN knockdown (ASO_LINC) in regions with differential binding of SMARCB1 (left), all regions bound by SMARCB1 (center), and regions with unaffected SMARCB1 binding upon SWINGN knockdown (right). c–e Significance has been calculated by t-test (represented as p-value) while difference between conditions has been measured by Euclidean distance (ED). f Distribution of chromatin states at all SMARCB1 peaks (left) and in the regions differentially bound by SMARCB1 upon SWINGN knockdown (right). g Heat map of selected genes differentially expressed upon SWINGN knockdown (RNA-seq) with a SMARCB1 or H3K27ac binding peak changing concordantly upon SWINGN depletion. h, i Genomic snapshot of SMARCB1 and H3K27ac ChIP-seq signals in control (ASO_CTRL) and SWINGN knockdown (ASO_LINC) conditions at GAS6/SWINGN (h) and PDGFRB (i) loci. Asterisks point out significantly changing peaks. The location of the primers used for ChIRP is indicated below. j RNA enrichment in ChIRP experiments with control (LacZ), CONCR and SWINGN probes determined by RT-qPCR and calculated as percentage of Input for the indicated transcripts. Graph shows mean ± SD of n = 5 (SWINGN) or n = 2 (CONCR). k DNA enrichment in ChIRP experiments with control (LacZ), CONCR and SWINGN probes determined by qPCR and calculated as percentage of Input with the indicated primer sets. Graph shows mean ± SEM of n = 4 (SWING) or n = 2 (CONCR). Source data underlying j–k panels are provided as a Source Data file. Student’s t-test p-values are summarized as follows: * < 0.05; ** < 0.01; *** < 0.001.

