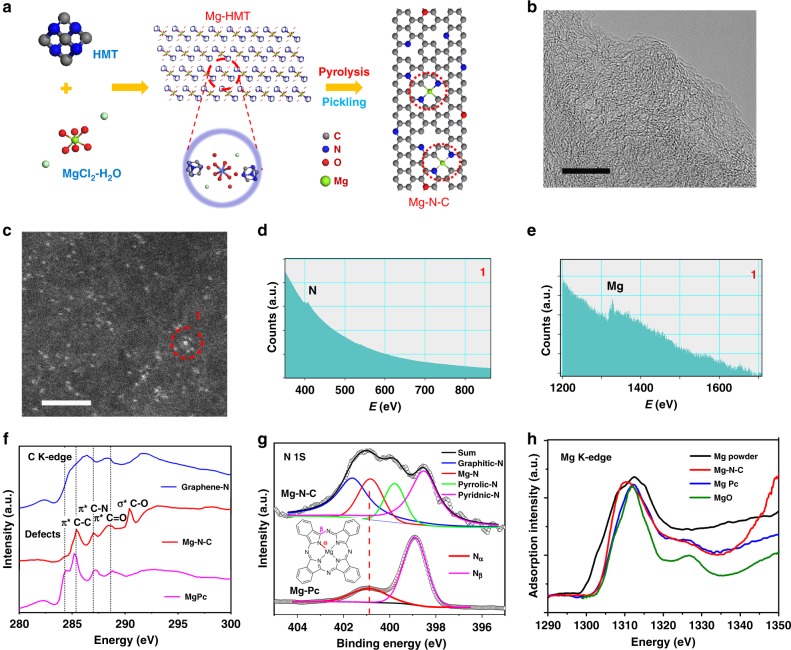
Fig. 3. The synthesis and characterization of Mg–N–C.
a Schematic illustration of the synthesis procedure of Mg–N–C. The red dash circles at Mg–N–C represents the active centers. b High resolution transmission electron microscopy (HRTEM) of Mg–N–C. Scale bar: 5 nm. c High-angle annular dark-field-scanning transmission electron microscopy (HAADF-STEM) image of Mg–N–C. Scale bar: 2 nm. The bright dots are Mg atoms, which can be confirmed by electron energy loss spectroscopy (EELS) spectra in d, e, probe resolution is 0.15 nm. d, e The EELS spectrum for atomic site highlighted by red circle in c. f C K-edge XANES spectrum of Graphene-N, Mg–N–C and MgPc. g The XPS result of the N 1s spectrum for Mg–N–C and MgPc. h The XANES of Mg K-edge for samples.

