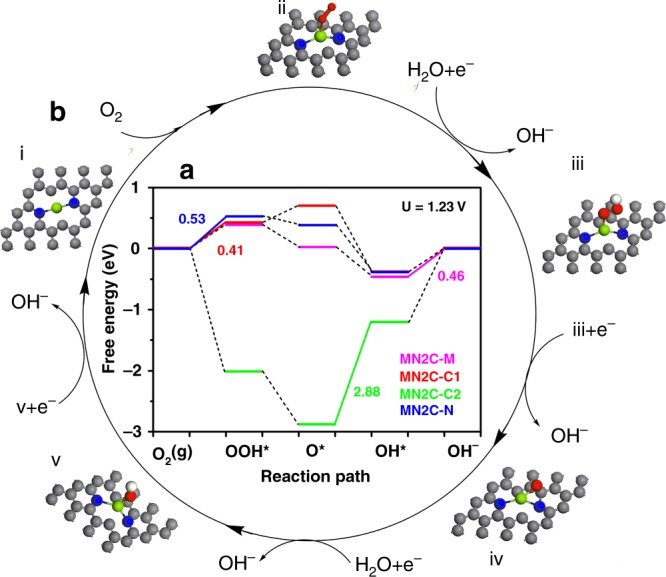
Fig. 5. The free energy diagram of MN2C and its possible reaction pathway.

a The free energy diagram of MN2C at different optimized adsorbed reaction sites at 1.23 V and the full oblique lines and corresponding value shows the RDS and energy barriers of catalysts. b Favorable reaction pathway of MN2C. And the active sites are Mg and C1 atoms. Green, blue, red, white and gray balls represent metal, N, O, H, and C atoms, respectively. Specially, the O* is adsorbed at both Mg and C1 adjacent to N atoms in (iv).
