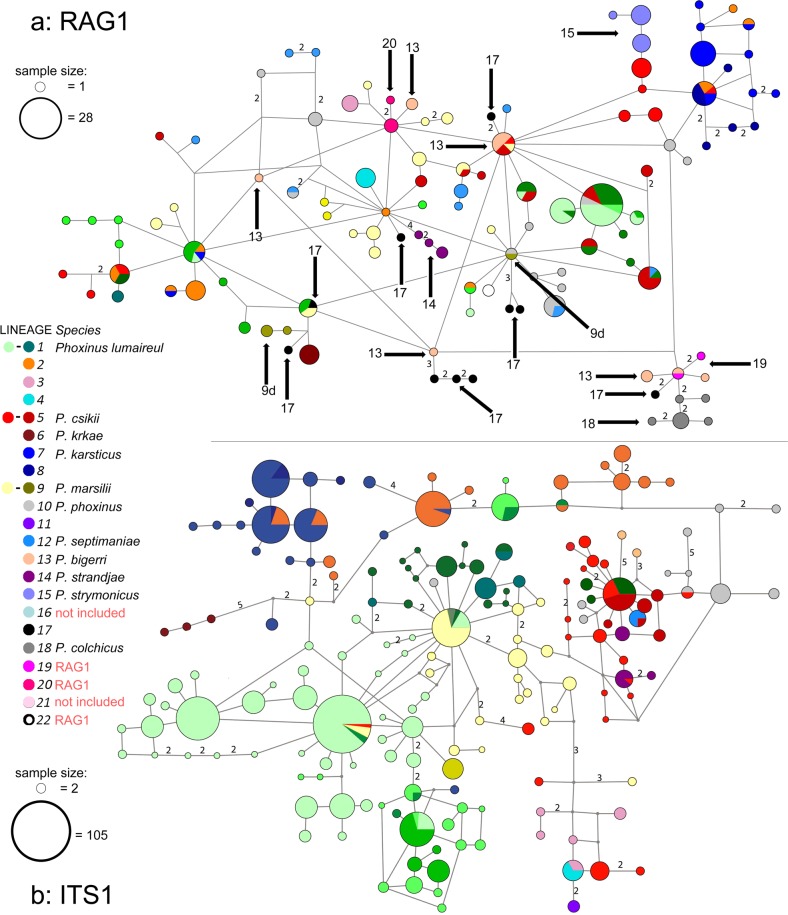
Fig. 4. Haplotype networks constructed with nuclear DNA.
a Haplotype network constructed with RAG1. Colours represent lineages detected by mtDNA analysis, and are shown in the legend. The gametic phase of heterozygous individuals was determined using Phase 2.1 (Stephens et al. 2001, Stephens and Scheet 2005). An unrooted minimum-spanning network was constructed with the median-joining algorithm (Bandelt et al. 1999) implemented in Network 5.1 (www.fluxus-engineering.com) with default settings. The lines carry the number of mutations where more than one. Circle size corresponds to haplotype frequency, with the biggest encompassing 28 samples. Arrows denote the lineages first presented by RAG1. b ITS1 haplotype network constructed using homozygotes, simple heterozygotes resolved by Phase 2.1 (Stephens et al. 2001, Stephens and Scheet 2005), and cloned samples. Lines carry the number of mutations when more than one. Circle size corresponds to haplotype frequency, with the biggest encompassing 105 samples. However, sampling was not distributed equally among the lineages, cloning revealed more than two haplotypes per sample and did not have the same success rate in all the lineages, while allele dropout might be present in museum samples. Thus, the size of the circles do not project a realistic picture of haplotype frequencies.

