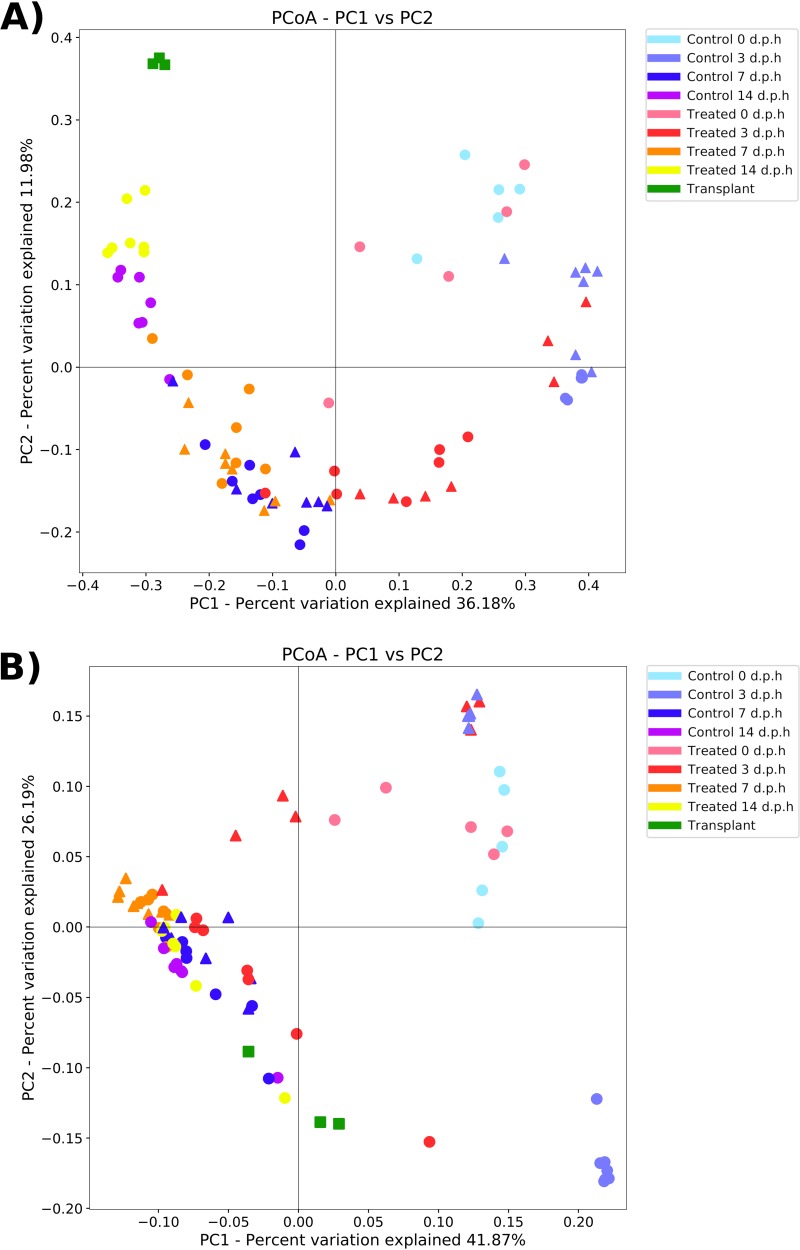
FIG 3.
Principal coordinate analysis (PCoA) plot showing differences in unweighted (A) and weighted (B) UniFrac beta diversity between sample groups and treatment groups in pilot (triangle) and repeat experiments (circle) and transplant samples (square). Each point represents an individual sample, with the distance between points representative of differences in microbiota composition.

