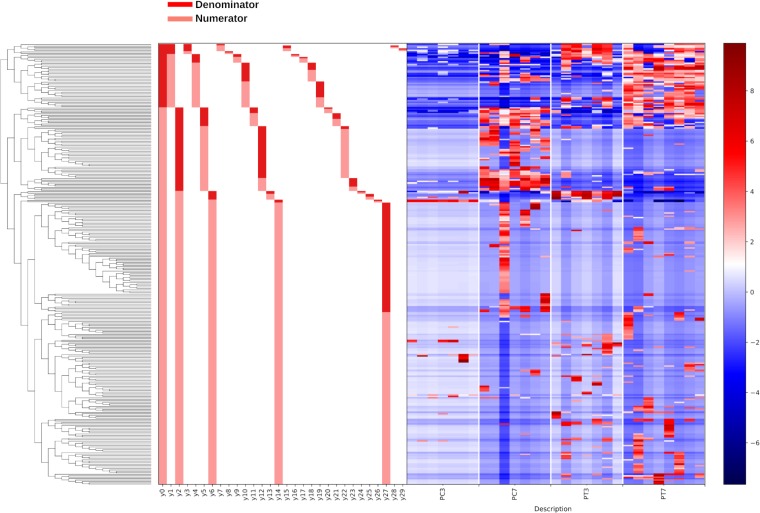
FIG 4.
A dendrogram heatmap of ASV log abundance in the cecal microbiota of control and treated chicks at 3 and 7 dph in the pilot experiment. The dendrogram represents the organization of ASVs within the system of balances created by hierarchical clustering. Each node on the dendrogram is a balance, with the first node designated balance y0. Each terminal branch represents an ASV present within the analysis. The bar charts visualize which ASVs are denominator (dark red) and which are numerator (light red) ASVs for each balance. The heatmap shows the log abundance of each ASV in the samples organized by group. Low-abundance ASVs are represented by blue, while higher-abundance ASVs are represented by red.

