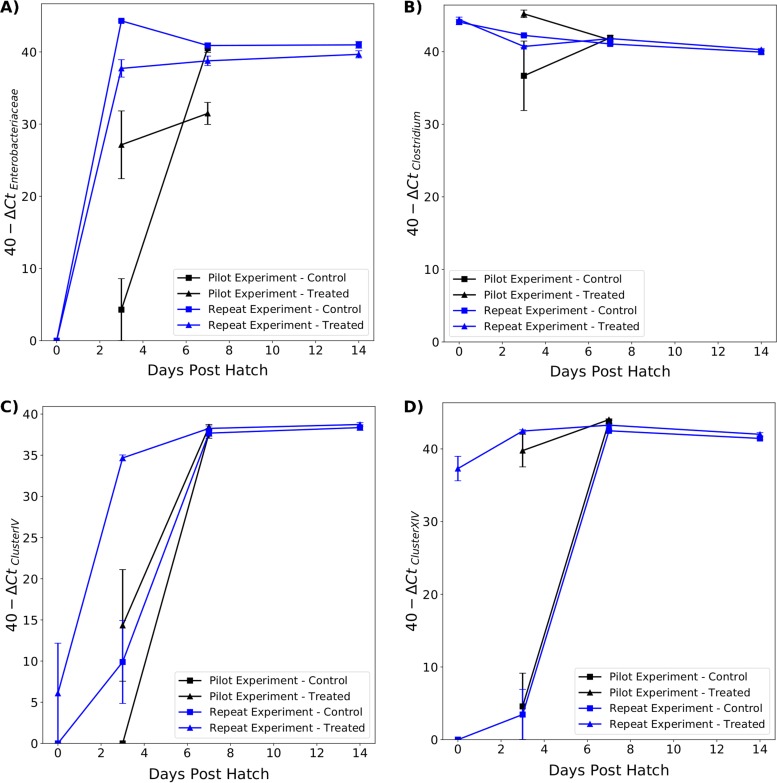
FIG 6.
Relative abundance of Enterobacteriaceae (A), Clostridium (B), Clostridium cluster IV (C), and Clostridium cluster XIV (a and b) (D) in the ceca of treated and control chicks between 0 and 14 dph. Significant differences between treated and control chicks in the pilot (black lines) and repeat (blue lines) experiments are indicated.

