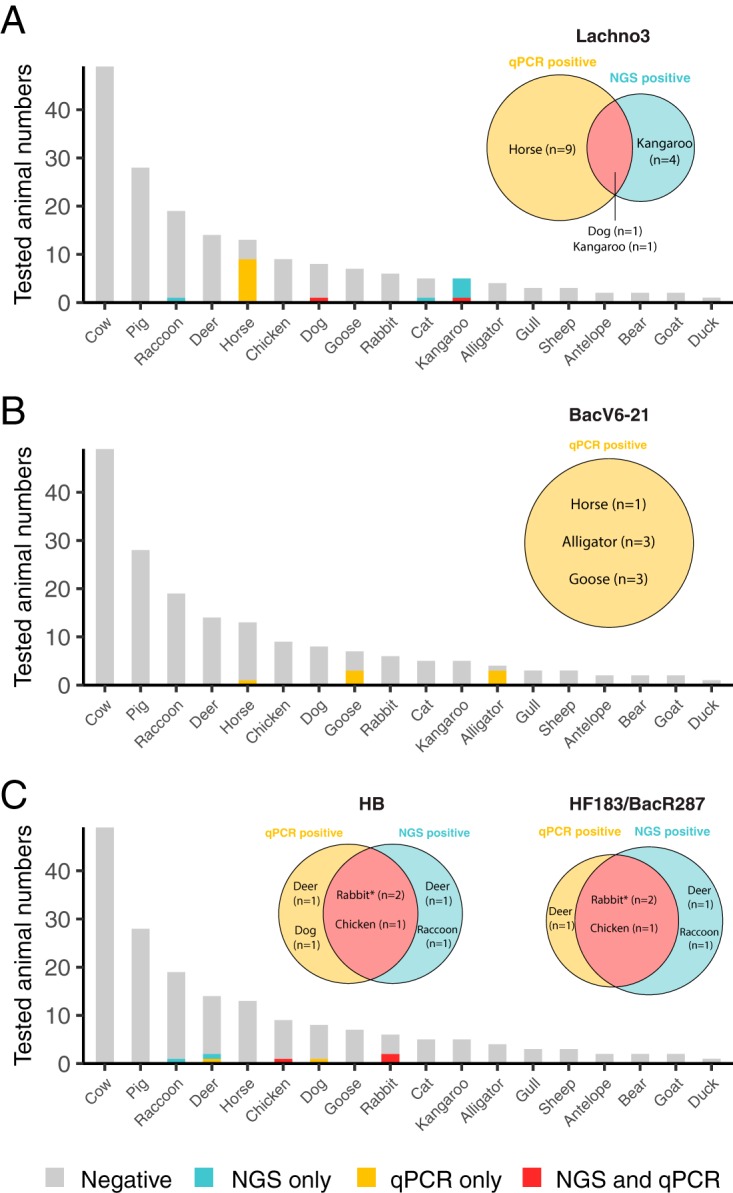
FIG 3.

NGS and qPCR validation results in 184 animal samples. Marker genes included are Lachno3 (A), BacV6-21 (B), and BacV6-4 (a proxy of HF183) (C). The x axis shows animal hosts. The y axis shows the total tested animal numbers. Gray bars represent the number of samples that are negative for both NGS and qPCR, blue bars represent the number of samples that are only positive in NGS data, yellow bars represent the number of samples that are only positive in qPCR, and red bars represent the number of samples that are positive in both NGS and qPCR. The Venn diagrams show positive animals of each marker gene in NGS and qPCR data. *, one of the HF183 marker-positive rabbits is sequenced as a pooled sample but tested in qPCR as five individuals.
