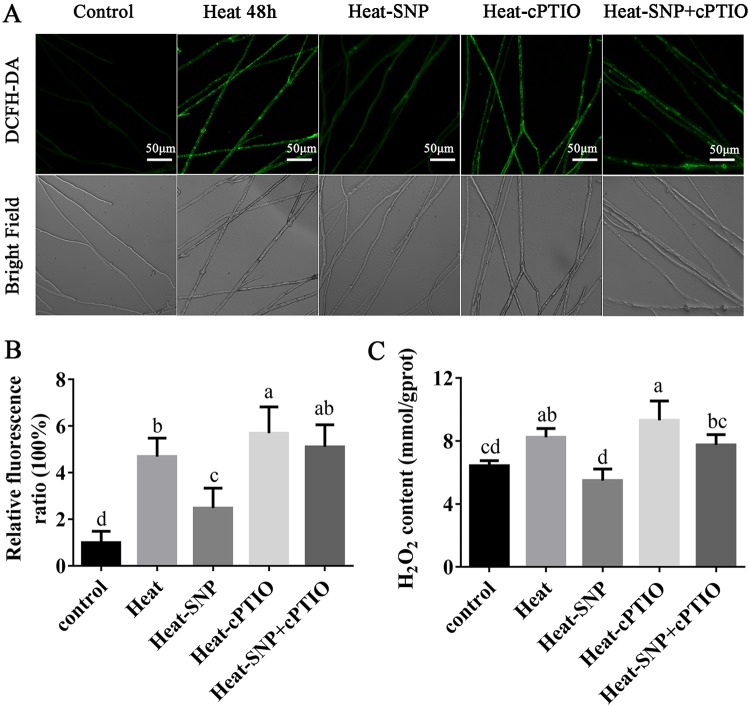
FIG 2.
The content of ROS and H2O2 in mycelia can be regulated by the addition of exogenous NO. (A) Change in ROS levels with 100 μM SNP and 250 μM cPTIO treatment, as detected by DCFH-DA staining. (B) Changes in the ROS fluorescence ratio with 100 μM SNP and 250 μM cPTIO. (C) H2O2 content with 100 μM SNP and 250 μM cPTIO. H2O2 was calculated according to the protein concentration, and gprot is protein amount (in g). The values are the mean ± SE of three independent experiments. Different letters indicate significant differences for the comparison of samples (P < 0.05 according to Duncan’s test).

