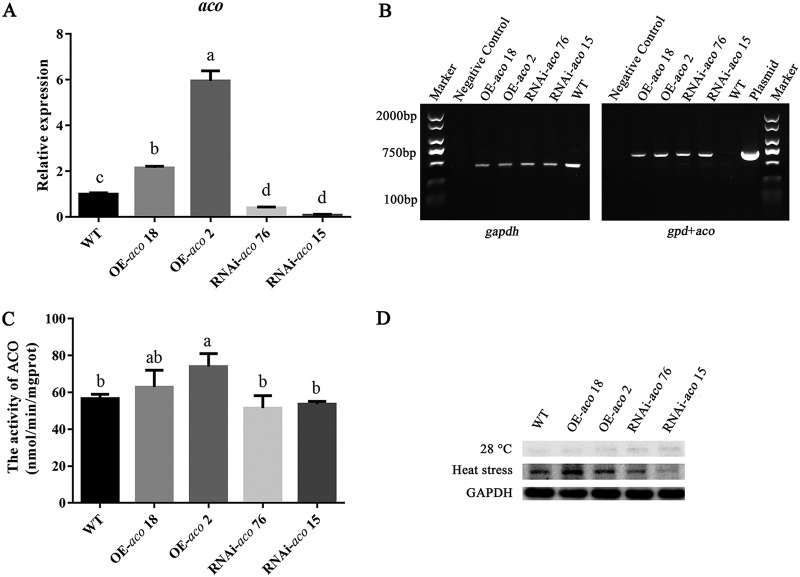
FIG 5.
Verification of OE-aco and RNAi-aco strains. (A) qPCR analysis of the expression of aco in the tested strains. (B) PCR assay of the gpd and aco genes and gapdh in P. ostreatus transformants, WT, and plasmid. (C) Determination of ACO activity in the tested strains. The activity of ACO was calculated according to the protein concentration, and mgprot is protein amount (in mg). (D) Protein expression level of ACO in the tested strains. Three independent biological replicates were performed for all experiments. The values are the mean ± SE. Different letters indicate significant differences for the comparison of samples (P < 0.05 according to Duncan’s test).

