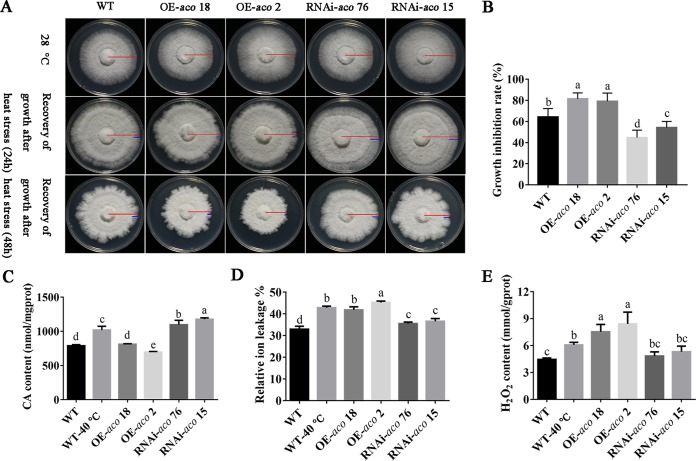
FIG 6.
aco participated in the response of P. ostreatus mycelia to heat stress. (A) Growth recovery conditions of the WT, OE-aco, and RNAi-aco strains after heat stress. Red lines represent the radius of mycelial growth over the entire growth time; blue lines represent the radius of mycelial growth recovery after heat stress. (B) Mycelial growth inhibition rates of the tested strains after heat stress. (C) CA content in tested strains. (D) Relative ion leakage of the tested strains after heat stress. (E) H2O2 content of the tested strains after heat stress. The CA and H2O2 contents were calculated according to the protein concentration, and mgprot and gprot represent protein amounts (in mg and g, respectively). Three independent biological replicates were performed for all experiments. The values are the mean ± SE. Different letters indicate significant differences for the comparison of samples (P < 0.05, according to Duncan’s test).

