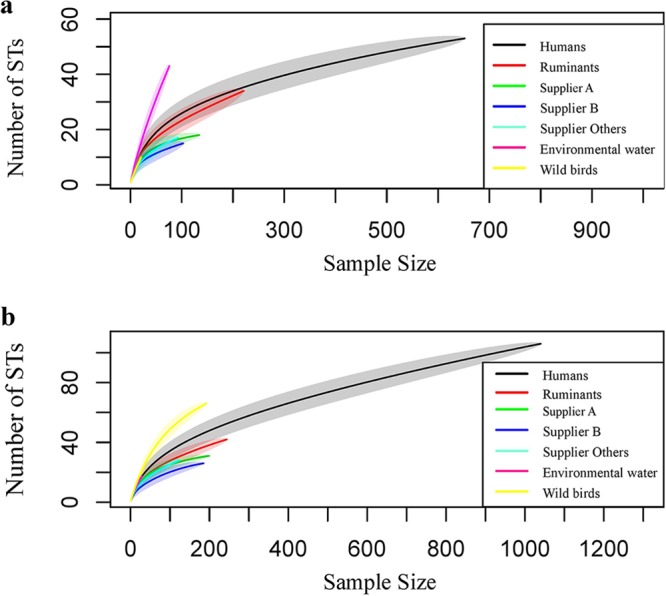
FIG 1.

Rarefaction curves before intervention (a) and after intervention (b) of the humans, chicken suppliers (A, B, and “others”), ruminants, environmental water, and wild bird C. jejuni STs. The shaded area represents the 95% CrI. In panel a, only ruminants’ upper boundary of the 95% CrI reach the point estimate of the human curve at maximum sample size. The wild bird curve overlaps the human curve, and the environmental water curve is steep. In panel b, none of the sources’ upper boundaries of the 95% CrI reach the point estimate of the human curve at maximum sample size.
