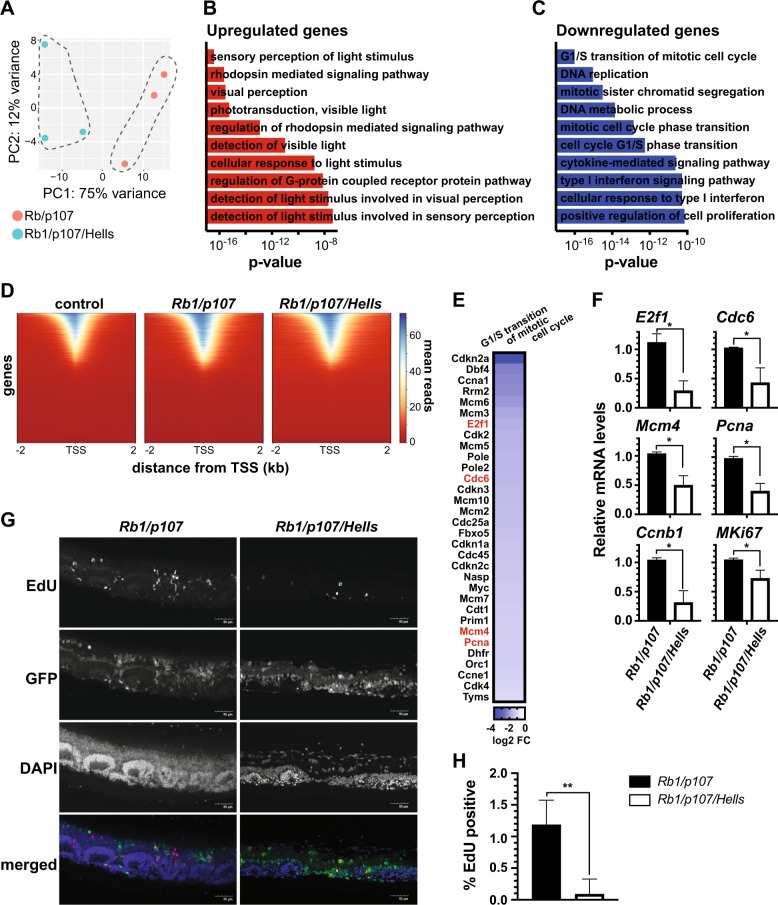
Fig. 5. HELLS is necessary for ectopic proliferation in Rb1/p107-null retinae.
a Principal components analysis (PCA) (2D loading plot) of RNA-seq data from three Rb1/p107 DKO and three Rb1/p107/Hells TKO P21 retinae show distinct transcriptome clusters. b, c p value ranking bar graph representing the ten most significant gene ontology (GO) biological processes for (b) upregulated genes and (c) downregulated genes in Rb1/p107/Hells TKO compared with Rb1/p107 DKO P21 retinae. d Genome-wide heatmap plot of chromatin accessibility peaks (ATAC-seq) from flow-sorted EGFP-negative Cre-negative Rb1/p107/Hells and EGFP-positive Rb1/p107 DKO and Rb1/p107/Hells TKO P21 retina grouped by mean reads and by distance from the transcription starting site (TSS). Each row represents a gene ordered in descending accessibility mean reads. e Heatmap of all differentially expressed genes GO clustered as G1/S transition of mitotic cell cycle in P21 retinae from Rb/p107 DKO compared with Rb1/p107/Hells TKO mice. Highlighted in red are known genes transcriptionally co-activated by HELLS. f Real-time RT-qPCR validation of some of the RNA-seq downregulated genes involved in cell cycle progression. n = 3; *p < 0.05 by unpaired t test. g Representative images of P21 retina cross-sections from Rb1/p107 DKO and Rb1/p107/Hells TKO Z/EG mice labeled with Click-iT EdU (proliferating cells; red). Nuclei were counterstained with DAPI (blue). EGFP fluorescence by the Z/EG reporter transgene captured areas of Chx10-Cre-mediated EGFP expression (green). Images taken on ×20 power field. Scale bar = 50 μm. h Quantification of the proportion of EdU-positive cells from dissociated retinae from Rb1/p107 DKO and Rb1/p107/Hells TKO mice from independent litters (n = 3). Each bar represents the mean ± SD of 2000 cells scored from each retina. **p < 0.0021 by unpaired t test.

