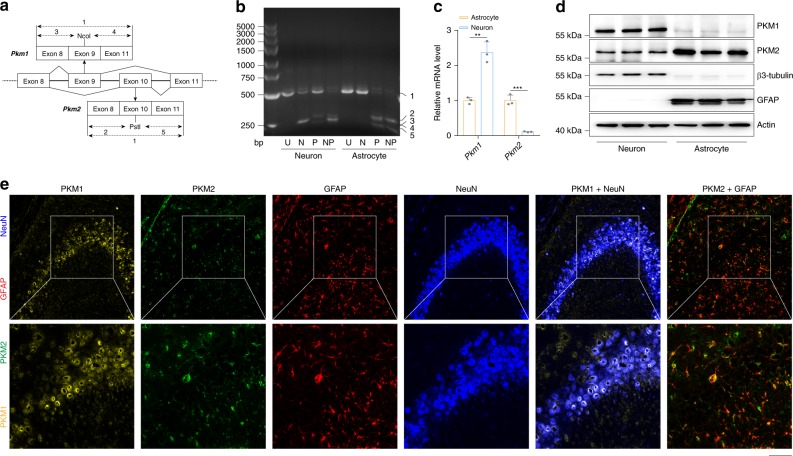
Fig. 4. Divergent expression patterns of PKM in neurons and astrocytes.
a Primers annealing to exons 8 and 11 were used to amplify PKM transcripts. The PCR products were cleaved with Ncol, Pstl or both to distinguish between the PKM1 (including exon 9) and PKM2 (including exon 10) isoforms. b RNA from primary neurons and astrocytes was analyzed by qRT-PCR, followed by digestion with Ncol (N), Pstl (P), or both enzymes (NP), plus an uncut control (U). The numbered bands are as follows: 1: uncut M1 or M2 (502 bp); 2: Pstl-cleaved M2 5’ fragment (286 bp); 3: Ncol-cleaved M1 5’ fragment (245 bp); 4: Ncol-cleaved M1 3’ fragment (240 bp); and 5: Pstl-cleaved M2 3’ fragment (216 bp). c Pkm1 and Pkm2 mRNA detected by qRT-PCR in primary neurons and astrocytes. d Immunoblotting with actin as a loading control. e PKM1 and PKM2 immunohistochemical signals in cortical neurons and astrocytes after tyramide signal amplification. Immunoblotting and qRT-PCR: three independent experiments. Scale bar, 50 µm. Data are presented as the mean ± s.e.m. ***P < 0.001. Student’s two-tailed unpaired t-test (c). Source data are provided as a Source Data file.

